Aleut vs Immigrants from Caribbean Per Capita Income
COMPARE
Aleut
Immigrants from Caribbean
Per Capita Income
Per Capita Income Comparison
Aleuts
Immigrants from Caribbean
$42,210
PER CAPITA INCOME
16.4/ 100
METRIC RATING
204th/ 347
METRIC RANK
$37,254
PER CAPITA INCOME
0.1/ 100
METRIC RATING
298th/ 347
METRIC RANK
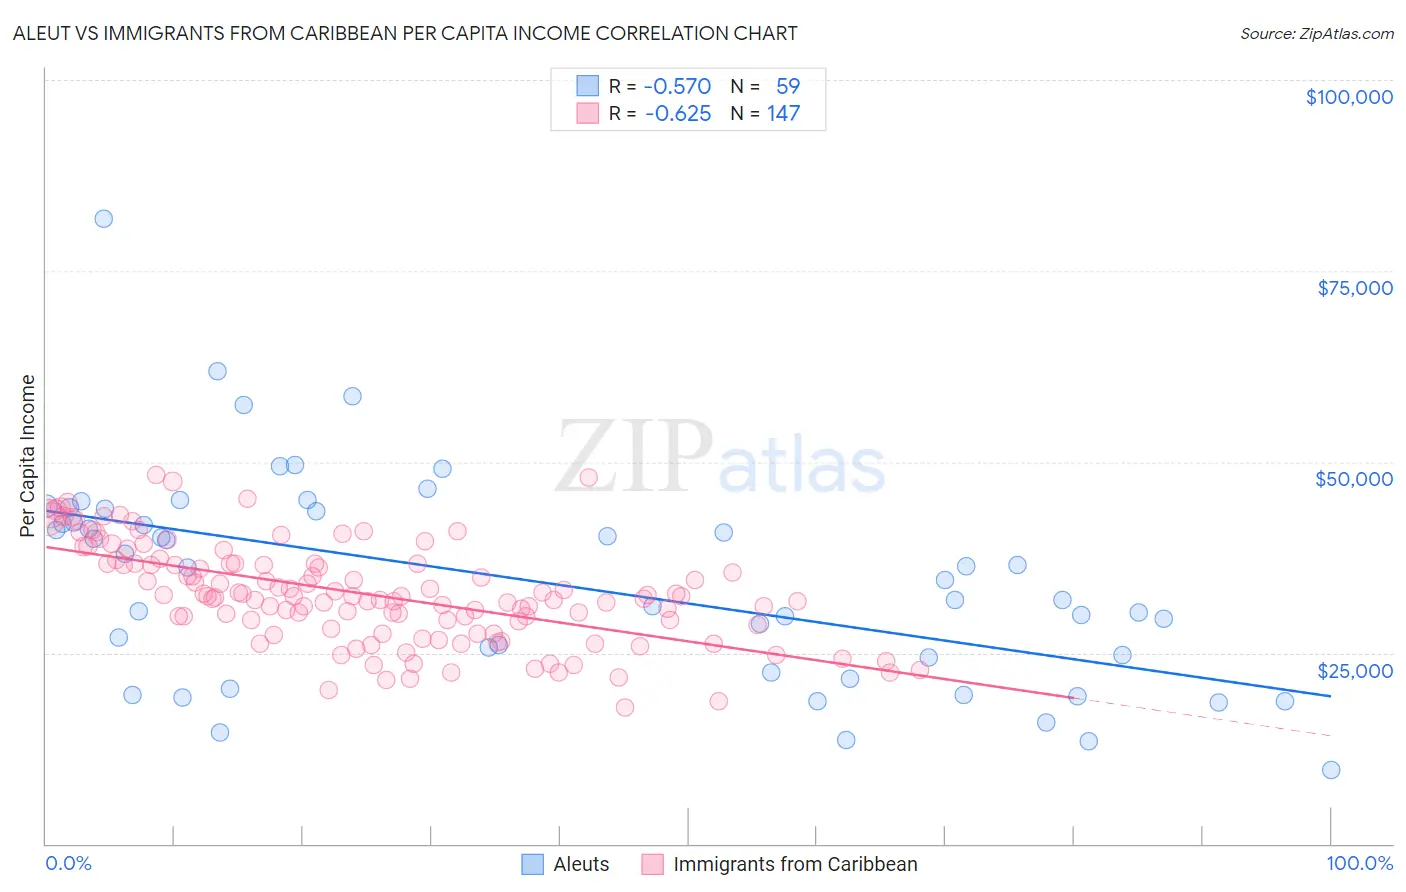
Aleut vs Immigrants from Caribbean Per Capita Income Correlation Chart
The statistical analysis conducted on geographies consisting of 61,782,949 people shows a substantial negative correlation between the proportion of Aleuts and per capita income in the United States with a correlation coefficient (R) of -0.570 and weighted average of $42,210. Similarly, the statistical analysis conducted on geographies consisting of 450,065,292 people shows a significant negative correlation between the proportion of Immigrants from Caribbean and per capita income in the United States with a correlation coefficient (R) of -0.625 and weighted average of $37,254, a difference of 13.3%.
Per Capita Income Correlation Summary
| Measurement | Aleut | Immigrants from Caribbean |
| Minimum | $9,575 | $17,858 |
| Maximum | $81,877 | $48,292 |
| Range | $72,302 | $30,434 |
| Mean | $34,258 | $32,742 |
| Median | $34,500 | $32,401 |
| Interquartile 25% (IQ1) | $22,490 | $28,636 |
| Interquartile 75% (IQ3) | $43,602 | $36,630 |
| Interquartile Range (IQR) | $21,112 | $7,994 |
| Standard Deviation (Sample) | $13,784 | $6,475 |
| Standard Deviation (Population) | $13,667 | $6,453 |
Similar Demographics by Per Capita Income
Demographics Similar to Aleuts by Per Capita Income
In terms of per capita income, the demographic groups most similar to Aleuts are White/Caucasian ($42,180, a difference of 0.070%), Spanish ($42,249, a difference of 0.090%), Ghanaian ($42,164, a difference of 0.11%), Immigrants from Bosnia and Herzegovina ($42,278, a difference of 0.16%), and Immigrants from Thailand ($42,289, a difference of 0.19%).
| Demographics | Rating | Rank | Per Capita Income |
| Scotch-Irish | 22.6 /100 | #197 | Fair $42,563 |
| Immigrants | Portugal | 19.7 /100 | #198 | Poor $42,412 |
| Barbadians | 19.6 /100 | #199 | Poor $42,406 |
| Vietnamese | 19.0 /100 | #200 | Poor $42,368 |
| Immigrants | Thailand | 17.6 /100 | #201 | Poor $42,289 |
| Immigrants | Bosnia and Herzegovina | 17.5 /100 | #202 | Poor $42,278 |
| Spanish | 17.0 /100 | #203 | Poor $42,249 |
| Aleuts | 16.4 /100 | #204 | Poor $42,210 |
| Whites/Caucasians | 15.9 /100 | #205 | Poor $42,180 |
| Ghanaians | 15.7 /100 | #206 | Poor $42,164 |
| Venezuelans | 14.4 /100 | #207 | Poor $42,074 |
| Panamanians | 13.9 /100 | #208 | Poor $42,035 |
| Immigrants | Sudan | 13.2 /100 | #209 | Poor $41,986 |
| Ecuadorians | 12.9 /100 | #210 | Poor $41,958 |
| Immigrants | Panama | 11.6 /100 | #211 | Poor $41,853 |
Demographics Similar to Immigrants from Caribbean by Per Capita Income
In terms of per capita income, the demographic groups most similar to Immigrants from Caribbean are Haitian ($37,289, a difference of 0.090%), Indonesian ($37,300, a difference of 0.12%), Immigrants from Dominican Republic ($37,306, a difference of 0.14%), Cherokee ($37,203, a difference of 0.14%), and Immigrants from Bahamas ($37,193, a difference of 0.17%).
| Demographics | Rating | Rank | Per Capita Income |
| Cajuns | 0.1 /100 | #291 | Tragic $37,527 |
| Immigrants | Micronesia | 0.1 /100 | #292 | Tragic $37,464 |
| Mexican American Indians | 0.1 /100 | #293 | Tragic $37,407 |
| Cubans | 0.1 /100 | #294 | Tragic $37,383 |
| Immigrants | Dominican Republic | 0.1 /100 | #295 | Tragic $37,306 |
| Indonesians | 0.1 /100 | #296 | Tragic $37,300 |
| Haitians | 0.1 /100 | #297 | Tragic $37,289 |
| Immigrants | Caribbean | 0.1 /100 | #298 | Tragic $37,254 |
| Cherokee | 0.1 /100 | #299 | Tragic $37,203 |
| Immigrants | Bahamas | 0.1 /100 | #300 | Tragic $37,193 |
| Ottawa | 0.1 /100 | #301 | Tragic $37,101 |
| Shoshone | 0.1 /100 | #302 | Tragic $37,072 |
| Paiute | 0.1 /100 | #303 | Tragic $37,066 |
| Hondurans | 0.1 /100 | #304 | Tragic $37,031 |
| Inupiat | 0.1 /100 | #305 | Tragic $36,999 |