Immigrants from Nicaragua vs Immigrants from Caribbean Per Capita Income
COMPARE
Immigrants from Nicaragua
Immigrants from Caribbean
Per Capita Income
Per Capita Income Comparison
Immigrants from Nicaragua
Immigrants from Caribbean
$38,065
PER CAPITA INCOME
0.2/ 100
METRIC RATING
278th/ 347
METRIC RANK
$37,254
PER CAPITA INCOME
0.1/ 100
METRIC RATING
298th/ 347
METRIC RANK
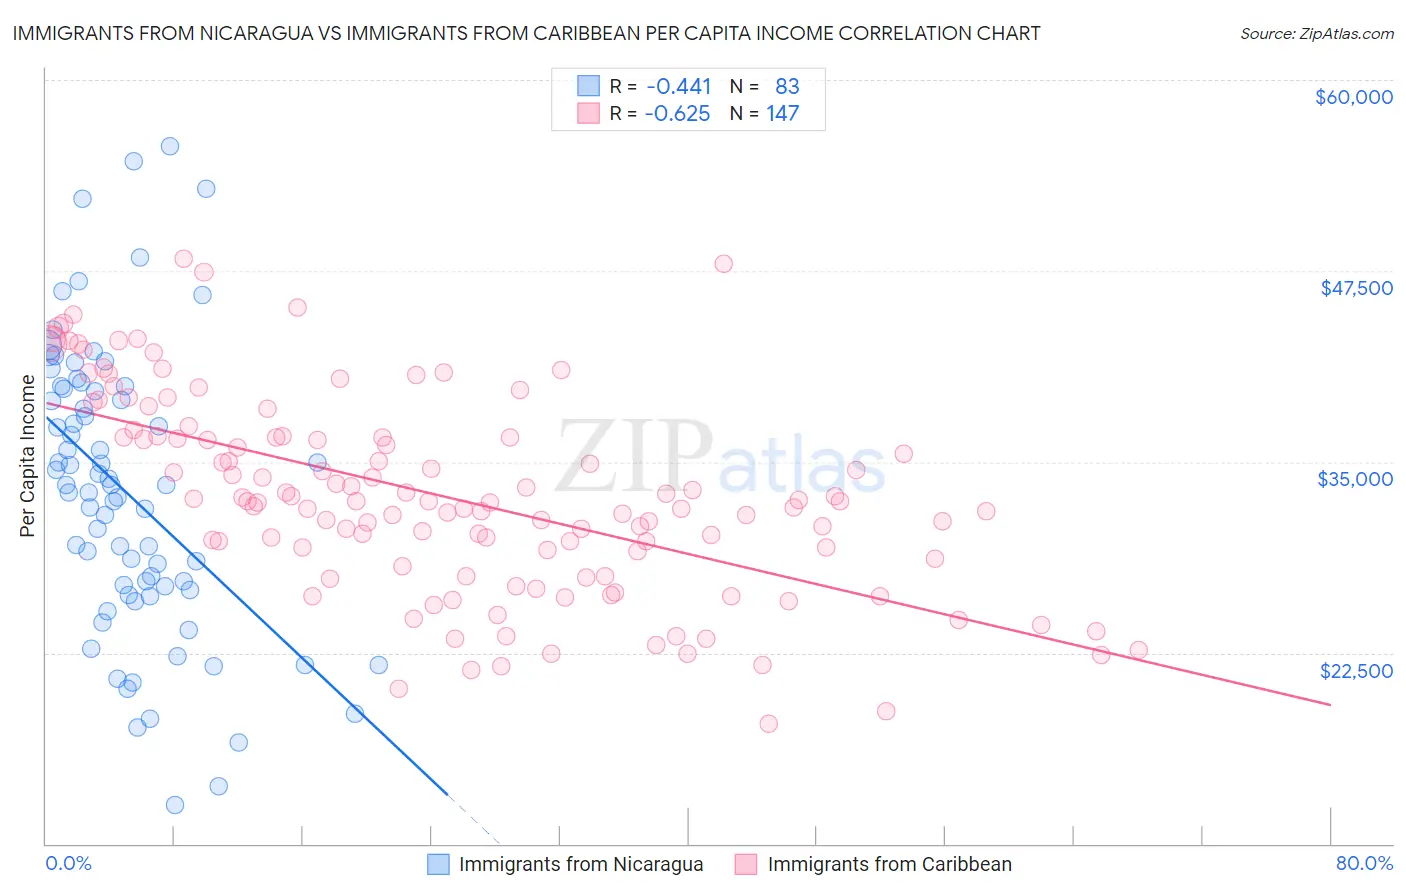
Immigrants from Nicaragua vs Immigrants from Caribbean Per Capita Income Correlation Chart
The statistical analysis conducted on geographies consisting of 236,340,517 people shows a moderate negative correlation between the proportion of Immigrants from Nicaragua and per capita income in the United States with a correlation coefficient (R) of -0.441 and weighted average of $38,065. Similarly, the statistical analysis conducted on geographies consisting of 450,065,292 people shows a significant negative correlation between the proportion of Immigrants from Caribbean and per capita income in the United States with a correlation coefficient (R) of -0.625 and weighted average of $37,254, a difference of 2.2%.
Per Capita Income Correlation Summary
| Measurement | Immigrants from Nicaragua | Immigrants from Caribbean |
| Minimum | $12,549 | $17,858 |
| Maximum | $55,632 | $48,292 |
| Range | $43,083 | $30,434 |
| Mean | $33,018 | $32,742 |
| Median | $33,470 | $32,401 |
| Interquartile 25% (IQ1) | $26,578 | $28,636 |
| Interquartile 75% (IQ3) | $39,762 | $36,630 |
| Interquartile Range (IQR) | $13,184 | $7,994 |
| Standard Deviation (Sample) | $9,366 | $6,475 |
| Standard Deviation (Population) | $9,309 | $6,453 |
Demographics Similar to Immigrants from Nicaragua and Immigrants from Caribbean by Per Capita Income
In terms of per capita income, the demographic groups most similar to Immigrants from Nicaragua are Colville ($38,047, a difference of 0.050%), Potawatomi ($38,046, a difference of 0.050%), Immigrants from Dominica ($37,952, a difference of 0.30%), Immigrants from Laos ($37,857, a difference of 0.55%), and Pennsylvania German ($37,842, a difference of 0.59%). Similarly, the demographic groups most similar to Immigrants from Caribbean are Haitian ($37,289, a difference of 0.090%), Indonesian ($37,300, a difference of 0.12%), Immigrants from Dominican Republic ($37,306, a difference of 0.14%), Cuban ($37,383, a difference of 0.34%), and Mexican American Indian ($37,407, a difference of 0.41%).
| Demographics | Rating | Rank | Per Capita Income |
| Immigrants | Nicaragua | 0.2 /100 | #278 | Tragic $38,065 |
| Colville | 0.2 /100 | #279 | Tragic $38,047 |
| Potawatomi | 0.2 /100 | #280 | Tragic $38,046 |
| Immigrants | Dominica | 0.2 /100 | #281 | Tragic $37,952 |
| Immigrants | Laos | 0.1 /100 | #282 | Tragic $37,857 |
| Pennsylvania Germans | 0.1 /100 | #283 | Tragic $37,842 |
| Africans | 0.1 /100 | #284 | Tragic $37,785 |
| Guatemalans | 0.1 /100 | #285 | Tragic $37,766 |
| Central American Indians | 0.1 /100 | #286 | Tragic $37,699 |
| Dominicans | 0.1 /100 | #287 | Tragic $37,697 |
| Blackfeet | 0.1 /100 | #288 | Tragic $37,695 |
| U.S. Virgin Islanders | 0.1 /100 | #289 | Tragic $37,589 |
| Immigrants | Guatemala | 0.1 /100 | #290 | Tragic $37,550 |
| Cajuns | 0.1 /100 | #291 | Tragic $37,527 |
| Immigrants | Micronesia | 0.1 /100 | #292 | Tragic $37,464 |
| Mexican American Indians | 0.1 /100 | #293 | Tragic $37,407 |
| Cubans | 0.1 /100 | #294 | Tragic $37,383 |
| Immigrants | Dominican Republic | 0.1 /100 | #295 | Tragic $37,306 |
| Indonesians | 0.1 /100 | #296 | Tragic $37,300 |
| Haitians | 0.1 /100 | #297 | Tragic $37,289 |
| Immigrants | Caribbean | 0.1 /100 | #298 | Tragic $37,254 |