Aleut vs Immigrants from Colombia Per Capita Income
COMPARE
Aleut
Immigrants from Colombia
Per Capita Income
Per Capita Income Comparison
Aleuts
Immigrants from Colombia
$42,210
PER CAPITA INCOME
16.4/ 100
METRIC RATING
204th/ 347
METRIC RANK
$42,971
PER CAPITA INCOME
31.5/ 100
METRIC RATING
187th/ 347
METRIC RANK
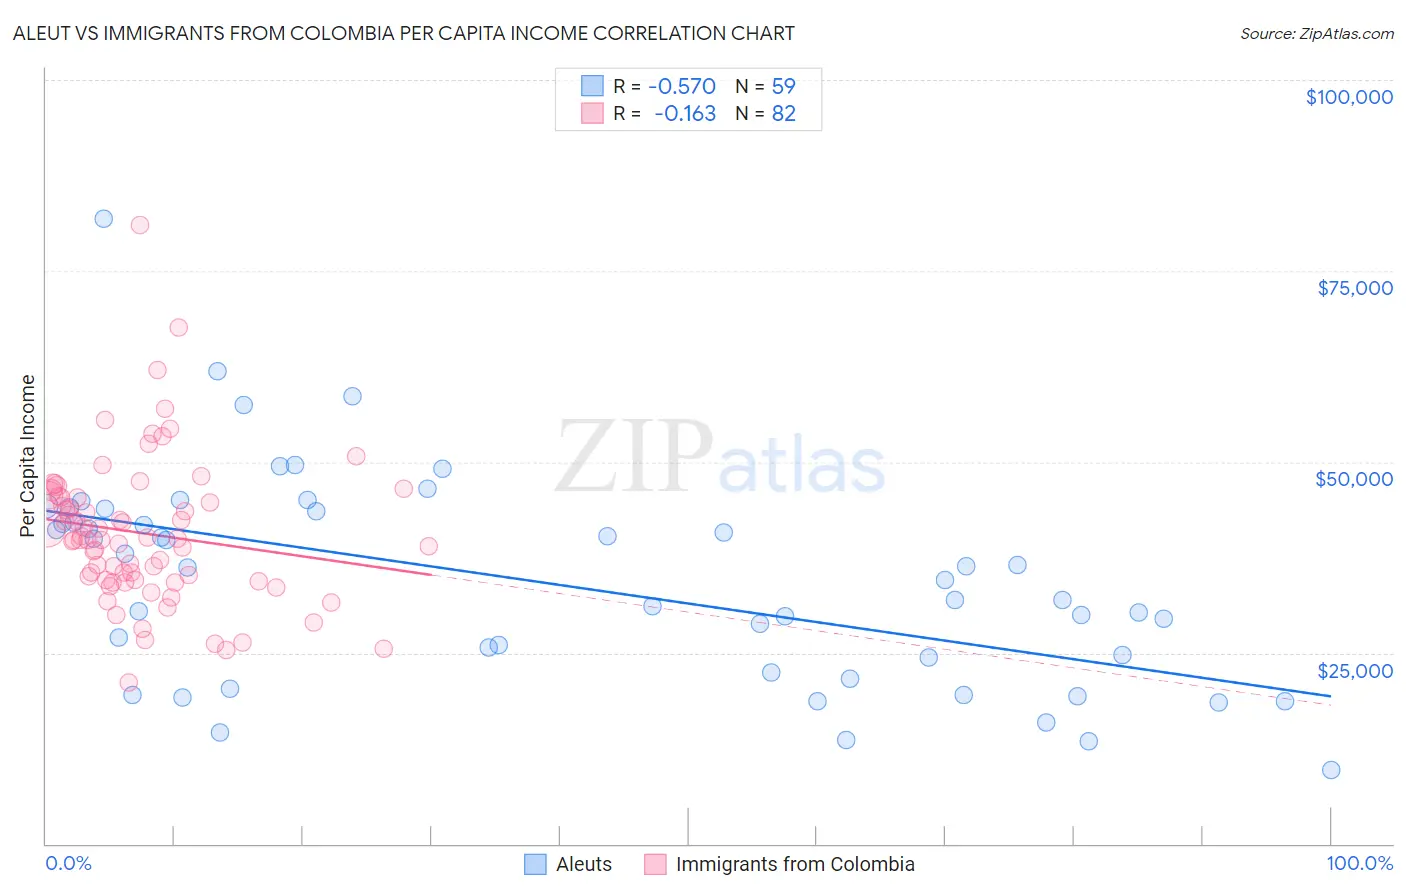
Aleut vs Immigrants from Colombia Per Capita Income Correlation Chart
The statistical analysis conducted on geographies consisting of 61,782,949 people shows a substantial negative correlation between the proportion of Aleuts and per capita income in the United States with a correlation coefficient (R) of -0.570 and weighted average of $42,210. Similarly, the statistical analysis conducted on geographies consisting of 378,698,677 people shows a poor negative correlation between the proportion of Immigrants from Colombia and per capita income in the United States with a correlation coefficient (R) of -0.163 and weighted average of $42,971, a difference of 1.8%.
Per Capita Income Correlation Summary
| Measurement | Aleut | Immigrants from Colombia |
| Minimum | $9,575 | $21,139 |
| Maximum | $81,877 | $80,934 |
| Range | $72,302 | $59,795 |
| Mean | $34,258 | $40,659 |
| Median | $34,500 | $39,822 |
| Interquartile 25% (IQ1) | $22,490 | $34,523 |
| Interquartile 75% (IQ3) | $43,602 | $45,376 |
| Interquartile Range (IQR) | $21,112 | $10,853 |
| Standard Deviation (Sample) | $13,784 | $9,573 |
| Standard Deviation (Population) | $13,667 | $9,515 |
Demographics Similar to Aleuts and Immigrants from Colombia by Per Capita Income
In terms of per capita income, the demographic groups most similar to Aleuts are White/Caucasian ($42,180, a difference of 0.070%), Spanish ($42,249, a difference of 0.090%), Immigrants from Bosnia and Herzegovina ($42,278, a difference of 0.16%), Immigrants from Thailand ($42,289, a difference of 0.19%), and Vietnamese ($42,368, a difference of 0.37%). Similarly, the demographic groups most similar to Immigrants from Colombia are Immigrants from Africa ($42,950, a difference of 0.050%), French Canadian ($43,003, a difference of 0.070%), Immigrants ($43,010, a difference of 0.090%), Bermudan ($42,911, a difference of 0.14%), and Kenyan ($42,808, a difference of 0.38%).
| Demographics | Rating | Rank | Per Capita Income |
| Immigrants | Immigrants | 32.5 /100 | #185 | Fair $43,010 |
| French Canadians | 32.3 /100 | #186 | Fair $43,003 |
| Immigrants | Colombia | 31.5 /100 | #187 | Fair $42,971 |
| Immigrants | Africa | 31.0 /100 | #188 | Fair $42,950 |
| Bermudans | 30.1 /100 | #189 | Fair $42,911 |
| Kenyans | 27.7 /100 | #190 | Fair $42,808 |
| Yugoslavians | 27.4 /100 | #191 | Fair $42,792 |
| Iraqis | 26.7 /100 | #192 | Fair $42,760 |
| Immigrants | Sierra Leone | 26.5 /100 | #193 | Fair $42,752 |
| Immigrants | Fiji | 25.2 /100 | #194 | Fair $42,694 |
| Immigrants | Kenya | 24.5 /100 | #195 | Fair $42,661 |
| Dutch | 23.4 /100 | #196 | Fair $42,605 |
| Scotch-Irish | 22.6 /100 | #197 | Fair $42,563 |
| Immigrants | Portugal | 19.7 /100 | #198 | Poor $42,412 |
| Barbadians | 19.6 /100 | #199 | Poor $42,406 |
| Vietnamese | 19.0 /100 | #200 | Poor $42,368 |
| Immigrants | Thailand | 17.6 /100 | #201 | Poor $42,289 |
| Immigrants | Bosnia and Herzegovina | 17.5 /100 | #202 | Poor $42,278 |
| Spanish | 17.0 /100 | #203 | Poor $42,249 |
| Aleuts | 16.4 /100 | #204 | Poor $42,210 |
| Whites/Caucasians | 15.9 /100 | #205 | Poor $42,180 |