Alaskan Athabascan vs Immigrants from Caribbean Per Capita Income
COMPARE
Alaskan Athabascan
Immigrants from Caribbean
Per Capita Income
Per Capita Income Comparison
Alaskan Athabascans
Immigrants from Caribbean
$39,163
PER CAPITA INCOME
0.6/ 100
METRIC RATING
260th/ 347
METRIC RANK
$37,254
PER CAPITA INCOME
0.1/ 100
METRIC RATING
298th/ 347
METRIC RANK
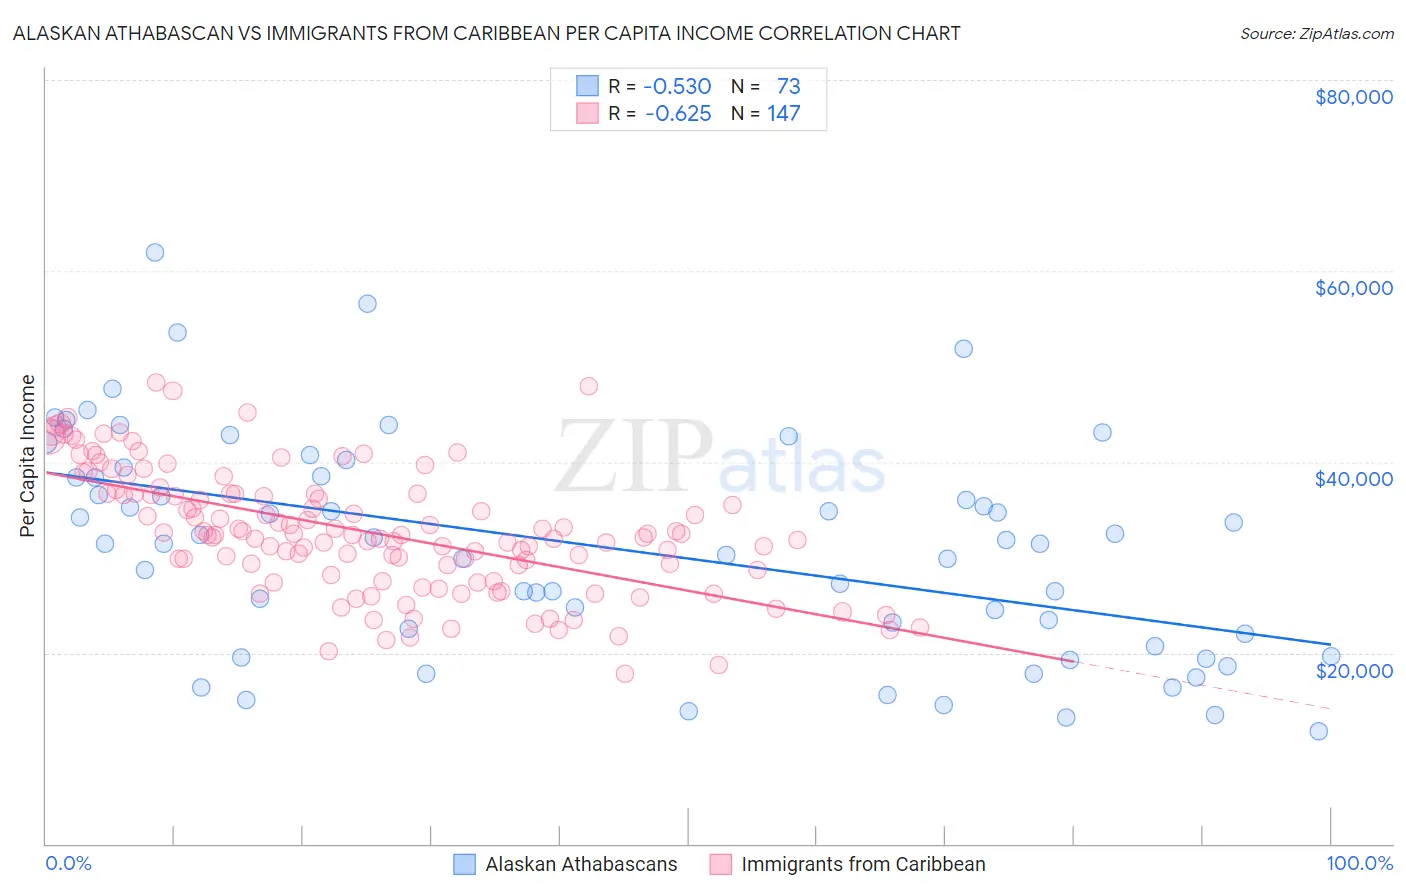
Alaskan Athabascan vs Immigrants from Caribbean Per Capita Income Correlation Chart
The statistical analysis conducted on geographies consisting of 45,821,401 people shows a substantial negative correlation between the proportion of Alaskan Athabascans and per capita income in the United States with a correlation coefficient (R) of -0.530 and weighted average of $39,163. Similarly, the statistical analysis conducted on geographies consisting of 450,065,292 people shows a significant negative correlation between the proportion of Immigrants from Caribbean and per capita income in the United States with a correlation coefficient (R) of -0.625 and weighted average of $37,254, a difference of 5.1%.
Per Capita Income Correlation Summary
| Measurement | Alaskan Athabascan | Immigrants from Caribbean |
| Minimum | $11,811 | $17,858 |
| Maximum | $61,991 | $48,292 |
| Range | $50,180 | $30,434 |
| Mean | $31,098 | $32,742 |
| Median | $31,460 | $32,401 |
| Interquartile 25% (IQ1) | $21,337 | $28,636 |
| Interquartile 75% (IQ3) | $38,931 | $36,630 |
| Interquartile Range (IQR) | $17,594 | $7,994 |
| Standard Deviation (Sample) | $11,398 | $6,475 |
| Standard Deviation (Population) | $11,320 | $6,453 |
Similar Demographics by Per Capita Income
Demographics Similar to Alaskan Athabascans by Per Capita Income
In terms of per capita income, the demographic groups most similar to Alaskan Athabascans are Malaysian ($39,194, a difference of 0.080%), Marshallese ($39,108, a difference of 0.14%), Iroquois ($39,104, a difference of 0.15%), Jamaican ($39,231, a difference of 0.17%), and Belizean ($39,097, a difference of 0.17%).
| Demographics | Rating | Rank | Per Capita Income |
| Osage | 1.0 /100 | #253 | Tragic $39,568 |
| Alaska Natives | 1.0 /100 | #254 | Tragic $39,558 |
| Immigrants | Middle Africa | 1.0 /100 | #255 | Tragic $39,529 |
| Hawaiians | 0.8 /100 | #256 | Tragic $39,403 |
| Nicaraguans | 0.8 /100 | #257 | Tragic $39,372 |
| Jamaicans | 0.7 /100 | #258 | Tragic $39,231 |
| Malaysians | 0.7 /100 | #259 | Tragic $39,194 |
| Alaskan Athabascans | 0.6 /100 | #260 | Tragic $39,163 |
| Marshallese | 0.6 /100 | #261 | Tragic $39,108 |
| Iroquois | 0.6 /100 | #262 | Tragic $39,104 |
| Belizeans | 0.6 /100 | #263 | Tragic $39,097 |
| Americans | 0.6 /100 | #264 | Tragic $39,039 |
| Spanish Americans | 0.5 /100 | #265 | Tragic $39,012 |
| Salvadorans | 0.5 /100 | #266 | Tragic $38,858 |
| Immigrants | Zaire | 0.4 /100 | #267 | Tragic $38,848 |
Demographics Similar to Immigrants from Caribbean by Per Capita Income
In terms of per capita income, the demographic groups most similar to Immigrants from Caribbean are Haitian ($37,289, a difference of 0.090%), Indonesian ($37,300, a difference of 0.12%), Immigrants from Dominican Republic ($37,306, a difference of 0.14%), Cherokee ($37,203, a difference of 0.14%), and Immigrants from Bahamas ($37,193, a difference of 0.17%).
| Demographics | Rating | Rank | Per Capita Income |
| Cajuns | 0.1 /100 | #291 | Tragic $37,527 |
| Immigrants | Micronesia | 0.1 /100 | #292 | Tragic $37,464 |
| Mexican American Indians | 0.1 /100 | #293 | Tragic $37,407 |
| Cubans | 0.1 /100 | #294 | Tragic $37,383 |
| Immigrants | Dominican Republic | 0.1 /100 | #295 | Tragic $37,306 |
| Indonesians | 0.1 /100 | #296 | Tragic $37,300 |
| Haitians | 0.1 /100 | #297 | Tragic $37,289 |
| Immigrants | Caribbean | 0.1 /100 | #298 | Tragic $37,254 |
| Cherokee | 0.1 /100 | #299 | Tragic $37,203 |
| Immigrants | Bahamas | 0.1 /100 | #300 | Tragic $37,193 |
| Ottawa | 0.1 /100 | #301 | Tragic $37,101 |
| Shoshone | 0.1 /100 | #302 | Tragic $37,072 |
| Paiute | 0.1 /100 | #303 | Tragic $37,066 |
| Hondurans | 0.1 /100 | #304 | Tragic $37,031 |
| Inupiat | 0.1 /100 | #305 | Tragic $36,999 |