Armenian vs Immigrants from Caribbean Per Capita Income
COMPARE
Armenian
Immigrants from Caribbean
Per Capita Income
Per Capita Income Comparison
Armenians
Immigrants from Caribbean
$48,287
PER CAPITA INCOME
99.4/ 100
METRIC RATING
81st/ 347
METRIC RANK
$37,254
PER CAPITA INCOME
0.1/ 100
METRIC RATING
298th/ 347
METRIC RANK
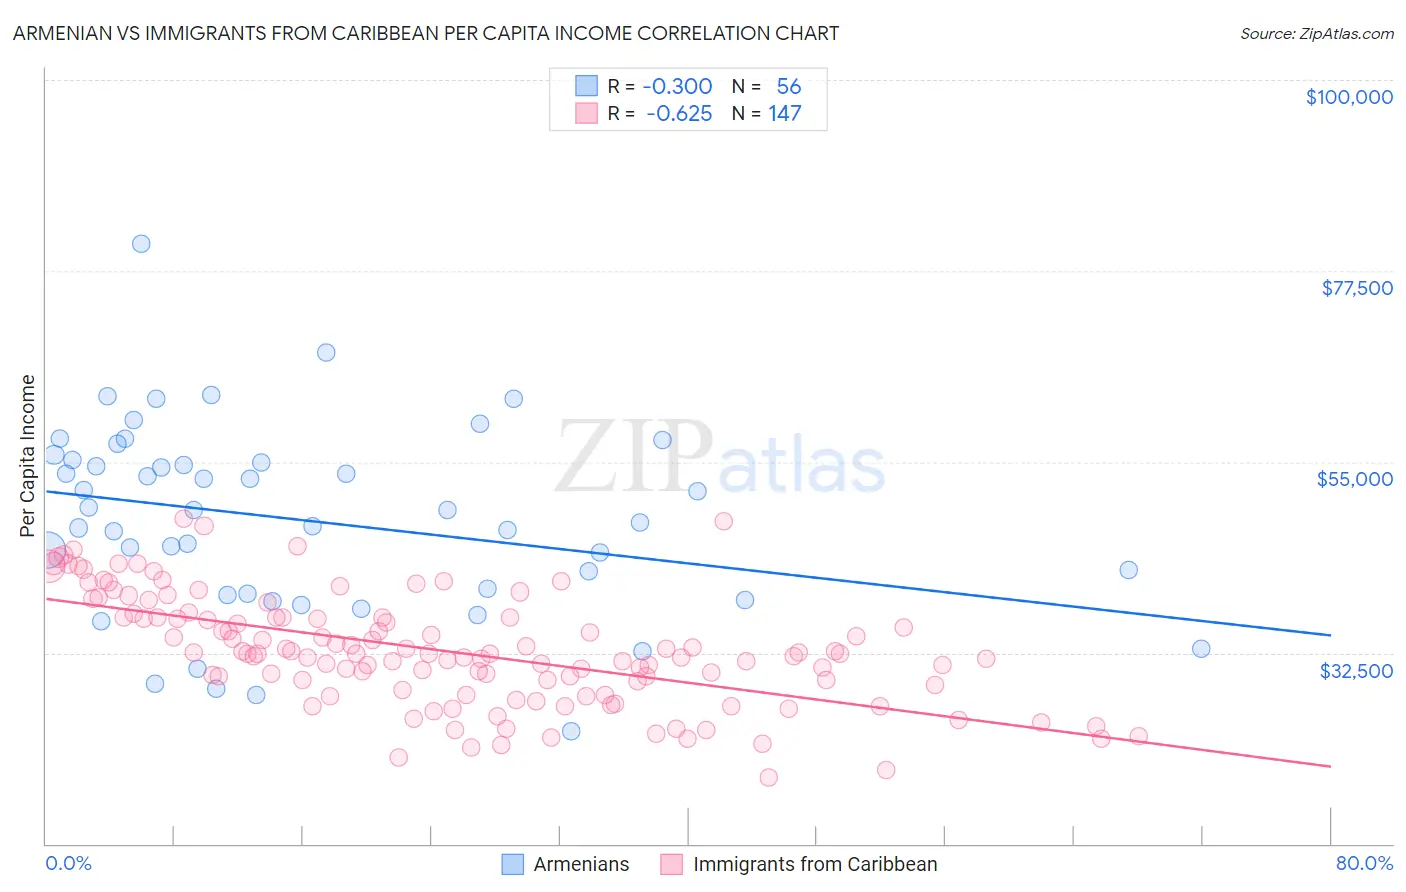
Armenian vs Immigrants from Caribbean Per Capita Income Correlation Chart
The statistical analysis conducted on geographies consisting of 310,965,464 people shows a mild negative correlation between the proportion of Armenians and per capita income in the United States with a correlation coefficient (R) of -0.300 and weighted average of $48,287. Similarly, the statistical analysis conducted on geographies consisting of 450,065,292 people shows a significant negative correlation between the proportion of Immigrants from Caribbean and per capita income in the United States with a correlation coefficient (R) of -0.625 and weighted average of $37,254, a difference of 29.6%.
Per Capita Income Correlation Summary
| Measurement | Armenian | Immigrants from Caribbean |
| Minimum | $23,281 | $17,858 |
| Maximum | $80,691 | $48,292 |
| Range | $57,410 | $30,434 |
| Mean | $48,045 | $32,742 |
| Median | $48,616 | $32,401 |
| Interquartile 25% (IQ1) | $39,345 | $28,636 |
| Interquartile 75% (IQ3) | $55,100 | $36,630 |
| Interquartile Range (IQR) | $15,755 | $7,994 |
| Standard Deviation (Sample) | $11,238 | $6,475 |
| Standard Deviation (Population) | $11,138 | $6,453 |
Similar Demographics by Per Capita Income
Demographics Similar to Armenians by Per Capita Income
In terms of per capita income, the demographic groups most similar to Armenians are Egyptian ($48,358, a difference of 0.15%), Immigrants from Indonesia ($48,195, a difference of 0.19%), Immigrants from Brazil ($48,164, a difference of 0.26%), Immigrants from Ukraine ($48,134, a difference of 0.32%), and Romanian ($48,445, a difference of 0.33%).
| Demographics | Rating | Rank | Per Capita Income |
| Mongolians | 99.8 /100 | #74 | Exceptional $49,173 |
| Immigrants | Bolivia | 99.7 /100 | #75 | Exceptional $48,970 |
| Immigrants | England | 99.7 /100 | #76 | Exceptional $48,844 |
| Immigrants | Kazakhstan | 99.7 /100 | #77 | Exceptional $48,747 |
| Immigrants | Italy | 99.6 /100 | #78 | Exceptional $48,654 |
| Romanians | 99.5 /100 | #79 | Exceptional $48,445 |
| Egyptians | 99.5 /100 | #80 | Exceptional $48,358 |
| Armenians | 99.4 /100 | #81 | Exceptional $48,287 |
| Immigrants | Indonesia | 99.4 /100 | #82 | Exceptional $48,195 |
| Immigrants | Brazil | 99.4 /100 | #83 | Exceptional $48,164 |
| Immigrants | Ukraine | 99.3 /100 | #84 | Exceptional $48,134 |
| Austrians | 99.3 /100 | #85 | Exceptional $48,116 |
| Immigrants | Southern Europe | 99.3 /100 | #86 | Exceptional $48,027 |
| Ukrainians | 99.3 /100 | #87 | Exceptional $48,014 |
| Croatians | 99.0 /100 | #88 | Exceptional $47,742 |
Demographics Similar to Immigrants from Caribbean by Per Capita Income
In terms of per capita income, the demographic groups most similar to Immigrants from Caribbean are Haitian ($37,289, a difference of 0.090%), Indonesian ($37,300, a difference of 0.12%), Immigrants from Dominican Republic ($37,306, a difference of 0.14%), Cherokee ($37,203, a difference of 0.14%), and Immigrants from Bahamas ($37,193, a difference of 0.17%).
| Demographics | Rating | Rank | Per Capita Income |
| Cajuns | 0.1 /100 | #291 | Tragic $37,527 |
| Immigrants | Micronesia | 0.1 /100 | #292 | Tragic $37,464 |
| Mexican American Indians | 0.1 /100 | #293 | Tragic $37,407 |
| Cubans | 0.1 /100 | #294 | Tragic $37,383 |
| Immigrants | Dominican Republic | 0.1 /100 | #295 | Tragic $37,306 |
| Indonesians | 0.1 /100 | #296 | Tragic $37,300 |
| Haitians | 0.1 /100 | #297 | Tragic $37,289 |
| Immigrants | Caribbean | 0.1 /100 | #298 | Tragic $37,254 |
| Cherokee | 0.1 /100 | #299 | Tragic $37,203 |
| Immigrants | Bahamas | 0.1 /100 | #300 | Tragic $37,193 |
| Ottawa | 0.1 /100 | #301 | Tragic $37,101 |
| Shoshone | 0.1 /100 | #302 | Tragic $37,072 |
| Paiute | 0.1 /100 | #303 | Tragic $37,066 |
| Hondurans | 0.1 /100 | #304 | Tragic $37,031 |
| Inupiat | 0.1 /100 | #305 | Tragic $36,999 |