Aleut vs Immigrants from Cameroon Per Capita Income
COMPARE
Aleut
Immigrants from Cameroon
Per Capita Income
Per Capita Income Comparison
Aleuts
Immigrants from Cameroon
$42,210
PER CAPITA INCOME
16.4/ 100
METRIC RATING
204th/ 347
METRIC RANK
$41,334
PER CAPITA INCOME
6.8/ 100
METRIC RATING
223rd/ 347
METRIC RANK
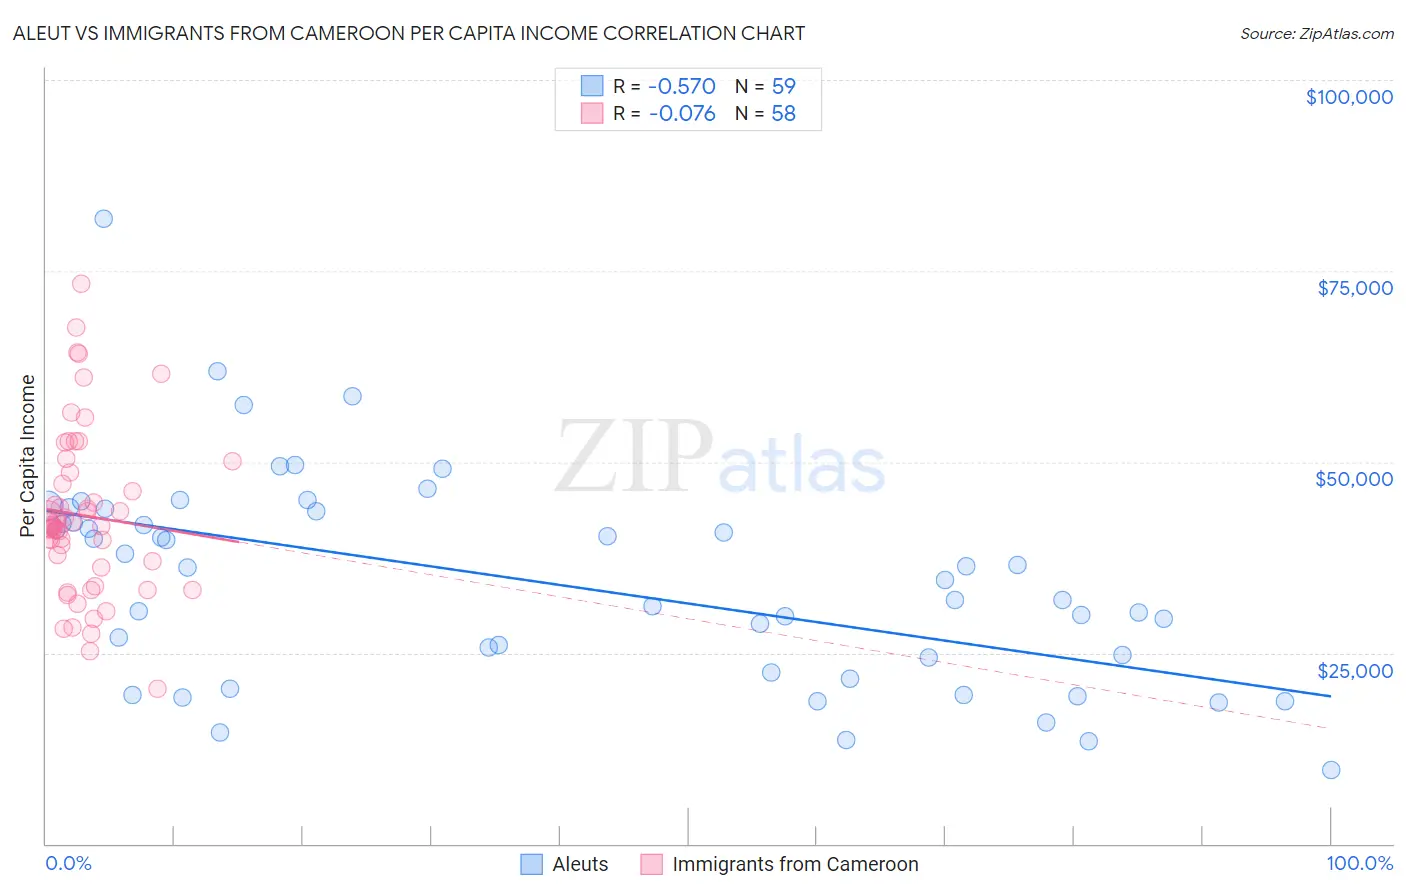
Aleut vs Immigrants from Cameroon Per Capita Income Correlation Chart
The statistical analysis conducted on geographies consisting of 61,782,949 people shows a substantial negative correlation between the proportion of Aleuts and per capita income in the United States with a correlation coefficient (R) of -0.570 and weighted average of $42,210. Similarly, the statistical analysis conducted on geographies consisting of 130,769,320 people shows a slight negative correlation between the proportion of Immigrants from Cameroon and per capita income in the United States with a correlation coefficient (R) of -0.076 and weighted average of $41,334, a difference of 2.1%.
Per Capita Income Correlation Summary
| Measurement | Aleut | Immigrants from Cameroon |
| Minimum | $9,575 | $20,282 |
| Maximum | $81,877 | $73,301 |
| Range | $72,302 | $53,019 |
| Mean | $34,258 | $42,979 |
| Median | $34,500 | $41,647 |
| Interquartile 25% (IQ1) | $22,490 | $36,092 |
| Interquartile 75% (IQ3) | $43,602 | $48,673 |
| Interquartile Range (IQR) | $21,112 | $12,582 |
| Standard Deviation (Sample) | $13,784 | $10,877 |
| Standard Deviation (Population) | $13,667 | $10,783 |
Demographics Similar to Aleuts and Immigrants from Cameroon by Per Capita Income
In terms of per capita income, the demographic groups most similar to Aleuts are White/Caucasian ($42,180, a difference of 0.070%), Spanish ($42,249, a difference of 0.090%), Ghanaian ($42,164, a difference of 0.11%), Venezuelan ($42,074, a difference of 0.32%), and Panamanian ($42,035, a difference of 0.42%). Similarly, the demographic groups most similar to Immigrants from Cameroon are Immigrants from Iraq ($41,365, a difference of 0.070%), Immigrants from Trinidad and Tobago ($41,476, a difference of 0.34%), Immigrants from Barbados ($41,478, a difference of 0.35%), Puget Sound Salish ($41,495, a difference of 0.39%), and Trinidadian and Tobagonian ($41,655, a difference of 0.78%).
| Demographics | Rating | Rank | Per Capita Income |
| Spanish | 17.0 /100 | #203 | Poor $42,249 |
| Aleuts | 16.4 /100 | #204 | Poor $42,210 |
| Whites/Caucasians | 15.9 /100 | #205 | Poor $42,180 |
| Ghanaians | 15.7 /100 | #206 | Poor $42,164 |
| Venezuelans | 14.4 /100 | #207 | Poor $42,074 |
| Panamanians | 13.9 /100 | #208 | Poor $42,035 |
| Immigrants | Sudan | 13.2 /100 | #209 | Poor $41,986 |
| Ecuadorians | 12.9 /100 | #210 | Poor $41,958 |
| Immigrants | Panama | 11.6 /100 | #211 | Poor $41,853 |
| Immigrants | Senegal | 11.3 /100 | #212 | Poor $41,830 |
| Immigrants | Venezuela | 10.2 /100 | #213 | Poor $41,727 |
| Immigrants | Bangladesh | 10.1 /100 | #214 | Poor $41,709 |
| Sudanese | 9.9 /100 | #215 | Tragic $41,695 |
| Tongans | 9.9 /100 | #216 | Tragic $41,693 |
| Guamanians/Chamorros | 9.7 /100 | #217 | Tragic $41,678 |
| Trinidadians and Tobagonians | 9.5 /100 | #218 | Tragic $41,655 |
| Puget Sound Salish | 8.1 /100 | #219 | Tragic $41,495 |
| Immigrants | Barbados | 7.9 /100 | #220 | Tragic $41,478 |
| Immigrants | Trinidad and Tobago | 7.9 /100 | #221 | Tragic $41,476 |
| Immigrants | Iraq | 7.1 /100 | #222 | Tragic $41,365 |
| Immigrants | Cameroon | 6.8 /100 | #223 | Tragic $41,334 |