Aleut vs Immigrants from Ghana Per Capita Income
COMPARE
Aleut
Immigrants from Ghana
Per Capita Income
Per Capita Income Comparison
Aleuts
Immigrants from Ghana
$42,210
PER CAPITA INCOME
16.4/ 100
METRIC RATING
204th/ 347
METRIC RANK
$41,131
PER CAPITA INCOME
5.5/ 100
METRIC RATING
227th/ 347
METRIC RANK
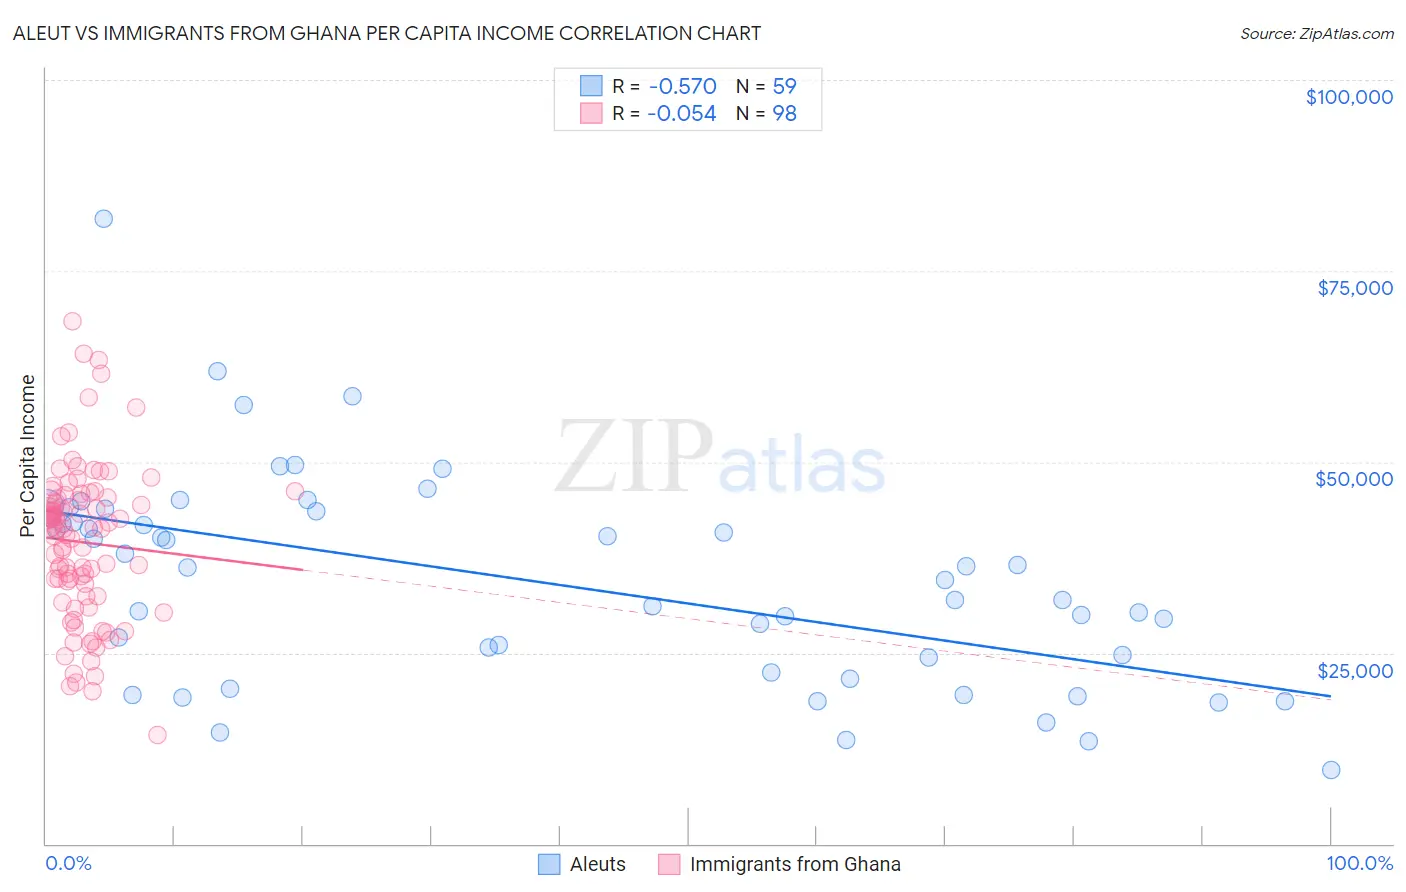
Aleut vs Immigrants from Ghana Per Capita Income Correlation Chart
The statistical analysis conducted on geographies consisting of 61,782,949 people shows a substantial negative correlation between the proportion of Aleuts and per capita income in the United States with a correlation coefficient (R) of -0.570 and weighted average of $42,210. Similarly, the statistical analysis conducted on geographies consisting of 199,964,611 people shows a slight negative correlation between the proportion of Immigrants from Ghana and per capita income in the United States with a correlation coefficient (R) of -0.054 and weighted average of $41,131, a difference of 2.6%.
Per Capita Income Correlation Summary
| Measurement | Aleut | Immigrants from Ghana |
| Minimum | $9,575 | $14,179 |
| Maximum | $81,877 | $68,358 |
| Range | $72,302 | $54,179 |
| Mean | $34,258 | $39,490 |
| Median | $34,500 | $41,313 |
| Interquartile 25% (IQ1) | $22,490 | $32,441 |
| Interquartile 75% (IQ3) | $43,602 | $45,276 |
| Interquartile Range (IQR) | $21,112 | $12,835 |
| Standard Deviation (Sample) | $13,784 | $10,193 |
| Standard Deviation (Population) | $13,667 | $10,141 |
Similar Demographics by Per Capita Income
Demographics Similar to Aleuts by Per Capita Income
In terms of per capita income, the demographic groups most similar to Aleuts are White/Caucasian ($42,180, a difference of 0.070%), Spanish ($42,249, a difference of 0.090%), Ghanaian ($42,164, a difference of 0.11%), Immigrants from Bosnia and Herzegovina ($42,278, a difference of 0.16%), and Immigrants from Thailand ($42,289, a difference of 0.19%).
| Demographics | Rating | Rank | Per Capita Income |
| Scotch-Irish | 22.6 /100 | #197 | Fair $42,563 |
| Immigrants | Portugal | 19.7 /100 | #198 | Poor $42,412 |
| Barbadians | 19.6 /100 | #199 | Poor $42,406 |
| Vietnamese | 19.0 /100 | #200 | Poor $42,368 |
| Immigrants | Thailand | 17.6 /100 | #201 | Poor $42,289 |
| Immigrants | Bosnia and Herzegovina | 17.5 /100 | #202 | Poor $42,278 |
| Spanish | 17.0 /100 | #203 | Poor $42,249 |
| Aleuts | 16.4 /100 | #204 | Poor $42,210 |
| Whites/Caucasians | 15.9 /100 | #205 | Poor $42,180 |
| Ghanaians | 15.7 /100 | #206 | Poor $42,164 |
| Venezuelans | 14.4 /100 | #207 | Poor $42,074 |
| Panamanians | 13.9 /100 | #208 | Poor $42,035 |
| Immigrants | Sudan | 13.2 /100 | #209 | Poor $41,986 |
| Ecuadorians | 12.9 /100 | #210 | Poor $41,958 |
| Immigrants | Panama | 11.6 /100 | #211 | Poor $41,853 |
Demographics Similar to Immigrants from Ghana by Per Capita Income
In terms of per capita income, the demographic groups most similar to Immigrants from Ghana are Immigrants from Grenada ($41,123, a difference of 0.020%), Immigrants from Ecuador ($41,195, a difference of 0.16%), West Indian ($41,217, a difference of 0.21%), Nigerian ($41,026, a difference of 0.26%), and Native Hawaiian ($41,017, a difference of 0.28%).
| Demographics | Rating | Rank | Per Capita Income |
| Immigrants | Barbados | 7.9 /100 | #220 | Tragic $41,478 |
| Immigrants | Trinidad and Tobago | 7.9 /100 | #221 | Tragic $41,476 |
| Immigrants | Iraq | 7.1 /100 | #222 | Tragic $41,365 |
| Immigrants | Cameroon | 6.8 /100 | #223 | Tragic $41,334 |
| Immigrants | St. Vincent and the Grenadines | 6.4 /100 | #224 | Tragic $41,270 |
| West Indians | 6.0 /100 | #225 | Tragic $41,217 |
| Immigrants | Ecuador | 5.9 /100 | #226 | Tragic $41,195 |
| Immigrants | Ghana | 5.5 /100 | #227 | Tragic $41,131 |
| Immigrants | Grenada | 5.5 /100 | #228 | Tragic $41,123 |
| Nigerians | 4.9 /100 | #229 | Tragic $41,026 |
| Native Hawaiians | 4.9 /100 | #230 | Tragic $41,017 |
| Senegalese | 4.8 /100 | #231 | Tragic $41,000 |
| Guyanese | 4.5 /100 | #232 | Tragic $40,949 |
| Delaware | 3.8 /100 | #233 | Tragic $40,778 |
| Immigrants | West Indies | 3.7 /100 | #234 | Tragic $40,763 |