Immigrants from Italy vs Immigrants from Caribbean Per Capita Income
COMPARE
Immigrants from Italy
Immigrants from Caribbean
Per Capita Income
Per Capita Income Comparison
Immigrants from Italy
Immigrants from Caribbean
$48,654
PER CAPITA INCOME
99.6/ 100
METRIC RATING
78th/ 347
METRIC RANK
$37,254
PER CAPITA INCOME
0.1/ 100
METRIC RATING
298th/ 347
METRIC RANK
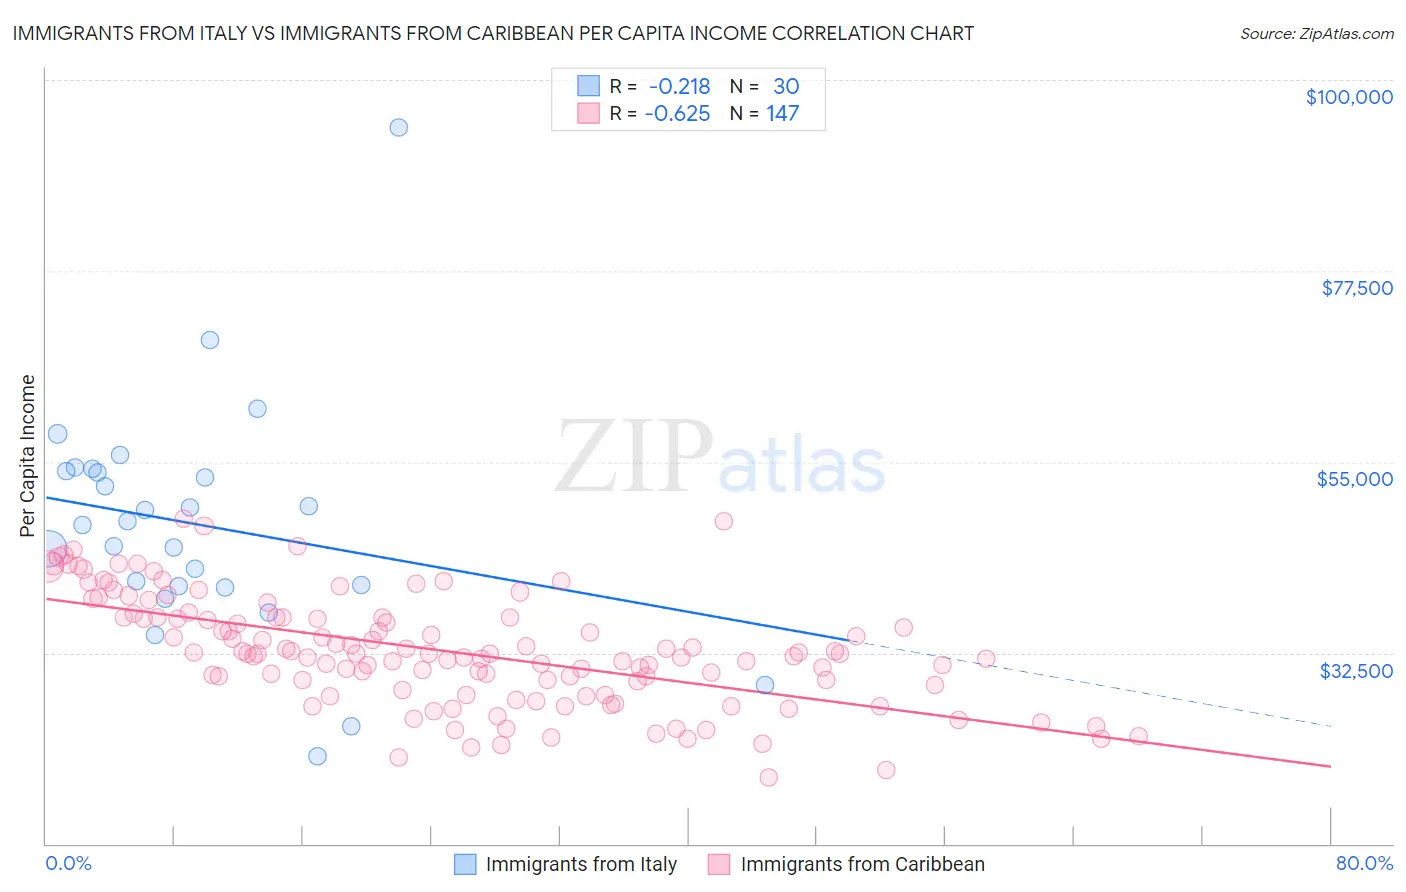
Immigrants from Italy vs Immigrants from Caribbean Per Capita Income Correlation Chart
The statistical analysis conducted on geographies consisting of 324,225,966 people shows a weak negative correlation between the proportion of Immigrants from Italy and per capita income in the United States with a correlation coefficient (R) of -0.218 and weighted average of $48,654. Similarly, the statistical analysis conducted on geographies consisting of 450,065,292 people shows a significant negative correlation between the proportion of Immigrants from Caribbean and per capita income in the United States with a correlation coefficient (R) of -0.625 and weighted average of $37,254, a difference of 30.6%.
Per Capita Income Correlation Summary
| Measurement | Immigrants from Italy | Immigrants from Caribbean |
| Minimum | $20,264 | $17,858 |
| Maximum | $94,379 | $48,292 |
| Range | $74,115 | $30,434 |
| Mean | $47,589 | $32,742 |
| Median | $47,756 | $32,401 |
| Interquartile 25% (IQ1) | $40,312 | $28,636 |
| Interquartile 75% (IQ3) | $53,919 | $36,630 |
| Interquartile Range (IQR) | $13,607 | $7,994 |
| Standard Deviation (Sample) | $13,819 | $6,475 |
| Standard Deviation (Population) | $13,587 | $6,453 |
Similar Demographics by Per Capita Income
Demographics Similar to Immigrants from Italy by Per Capita Income
In terms of per capita income, the demographic groups most similar to Immigrants from Italy are Immigrants from Kazakhstan ($48,747, a difference of 0.19%), Immigrants from England ($48,844, a difference of 0.39%), Romanian ($48,445, a difference of 0.43%), Egyptian ($48,358, a difference of 0.61%), and Immigrants from Bolivia ($48,970, a difference of 0.65%).
| Demographics | Rating | Rank | Per Capita Income |
| Greeks | 99.8 /100 | #71 | Exceptional $49,309 |
| Immigrants | Hungary | 99.8 /100 | #72 | Exceptional $49,303 |
| Immigrants | North America | 99.8 /100 | #73 | Exceptional $49,302 |
| Mongolians | 99.8 /100 | #74 | Exceptional $49,173 |
| Immigrants | Bolivia | 99.7 /100 | #75 | Exceptional $48,970 |
| Immigrants | England | 99.7 /100 | #76 | Exceptional $48,844 |
| Immigrants | Kazakhstan | 99.7 /100 | #77 | Exceptional $48,747 |
| Immigrants | Italy | 99.6 /100 | #78 | Exceptional $48,654 |
| Romanians | 99.5 /100 | #79 | Exceptional $48,445 |
| Egyptians | 99.5 /100 | #80 | Exceptional $48,358 |
| Armenians | 99.4 /100 | #81 | Exceptional $48,287 |
| Immigrants | Indonesia | 99.4 /100 | #82 | Exceptional $48,195 |
| Immigrants | Brazil | 99.4 /100 | #83 | Exceptional $48,164 |
| Immigrants | Ukraine | 99.3 /100 | #84 | Exceptional $48,134 |
| Austrians | 99.3 /100 | #85 | Exceptional $48,116 |
Demographics Similar to Immigrants from Caribbean by Per Capita Income
In terms of per capita income, the demographic groups most similar to Immigrants from Caribbean are Haitian ($37,289, a difference of 0.090%), Indonesian ($37,300, a difference of 0.12%), Immigrants from Dominican Republic ($37,306, a difference of 0.14%), Cherokee ($37,203, a difference of 0.14%), and Immigrants from Bahamas ($37,193, a difference of 0.17%).
| Demographics | Rating | Rank | Per Capita Income |
| Cajuns | 0.1 /100 | #291 | Tragic $37,527 |
| Immigrants | Micronesia | 0.1 /100 | #292 | Tragic $37,464 |
| Mexican American Indians | 0.1 /100 | #293 | Tragic $37,407 |
| Cubans | 0.1 /100 | #294 | Tragic $37,383 |
| Immigrants | Dominican Republic | 0.1 /100 | #295 | Tragic $37,306 |
| Indonesians | 0.1 /100 | #296 | Tragic $37,300 |
| Haitians | 0.1 /100 | #297 | Tragic $37,289 |
| Immigrants | Caribbean | 0.1 /100 | #298 | Tragic $37,254 |
| Cherokee | 0.1 /100 | #299 | Tragic $37,203 |
| Immigrants | Bahamas | 0.1 /100 | #300 | Tragic $37,193 |
| Ottawa | 0.1 /100 | #301 | Tragic $37,101 |
| Shoshone | 0.1 /100 | #302 | Tragic $37,072 |
| Paiute | 0.1 /100 | #303 | Tragic $37,066 |
| Hondurans | 0.1 /100 | #304 | Tragic $37,031 |
| Inupiat | 0.1 /100 | #305 | Tragic $36,999 |