Dutch West Indian vs Immigrants from Caribbean Per Capita Income
COMPARE
Dutch West Indian
Immigrants from Caribbean
Per Capita Income
Per Capita Income Comparison
Dutch West Indians
Immigrants from Caribbean
$35,922
PER CAPITA INCOME
0.0/ 100
METRIC RATING
317th/ 347
METRIC RANK
$37,254
PER CAPITA INCOME
0.1/ 100
METRIC RATING
298th/ 347
METRIC RANK
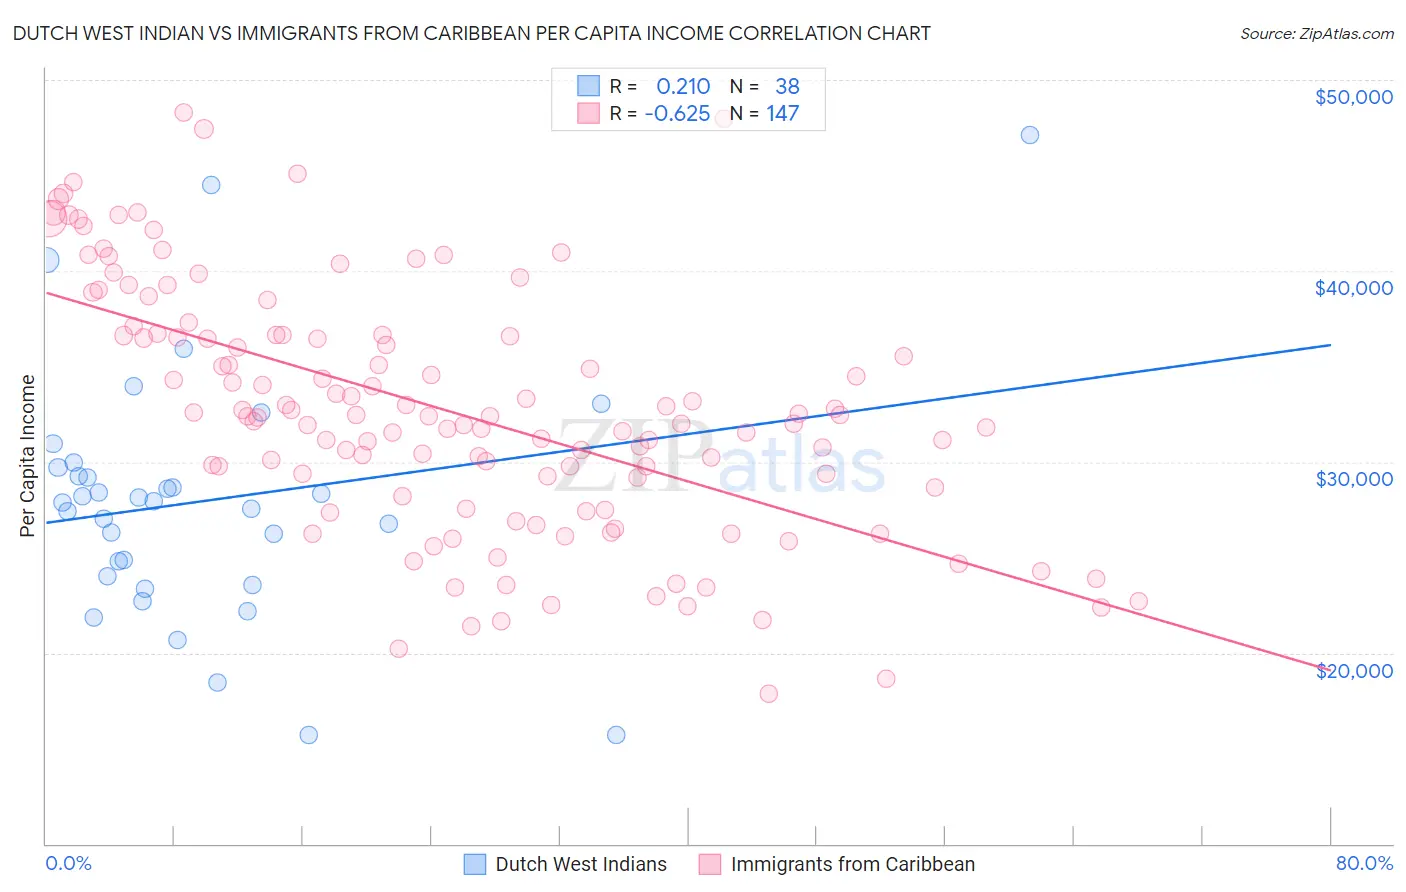
Dutch West Indian vs Immigrants from Caribbean Per Capita Income Correlation Chart
The statistical analysis conducted on geographies consisting of 85,776,103 people shows a weak positive correlation between the proportion of Dutch West Indians and per capita income in the United States with a correlation coefficient (R) of 0.210 and weighted average of $35,922. Similarly, the statistical analysis conducted on geographies consisting of 450,065,292 people shows a significant negative correlation between the proportion of Immigrants from Caribbean and per capita income in the United States with a correlation coefficient (R) of -0.625 and weighted average of $37,254, a difference of 3.7%.
Per Capita Income Correlation Summary
| Measurement | Dutch West Indian | Immigrants from Caribbean |
| Minimum | $15,696 | $17,858 |
| Maximum | $47,132 | $48,292 |
| Range | $31,436 | $30,434 |
| Mean | $27,952 | $32,742 |
| Median | $27,901 | $32,401 |
| Interquartile 25% (IQ1) | $24,038 | $28,636 |
| Interquartile 75% (IQ3) | $29,729 | $36,630 |
| Interquartile Range (IQR) | $5,691 | $7,994 |
| Standard Deviation (Sample) | $6,566 | $6,475 |
| Standard Deviation (Population) | $6,479 | $6,453 |
Demographics Similar to Dutch West Indians and Immigrants from Caribbean by Per Capita Income
In terms of per capita income, the demographic groups most similar to Dutch West Indians are Choctaw ($35,999, a difference of 0.21%), Yaqui ($36,112, a difference of 0.53%), Seminole ($36,180, a difference of 0.72%), Bahamian ($36,427, a difference of 1.4%), and Chickasaw ($36,475, a difference of 1.5%). Similarly, the demographic groups most similar to Immigrants from Caribbean are Haitian ($37,289, a difference of 0.090%), Cherokee ($37,203, a difference of 0.14%), Immigrants from Bahamas ($37,193, a difference of 0.17%), Ottawa ($37,101, a difference of 0.41%), and Shoshone ($37,072, a difference of 0.49%).
| Demographics | Rating | Rank | Per Capita Income |
| Haitians | 0.1 /100 | #297 | Tragic $37,289 |
| Immigrants | Caribbean | 0.1 /100 | #298 | Tragic $37,254 |
| Cherokee | 0.1 /100 | #299 | Tragic $37,203 |
| Immigrants | Bahamas | 0.1 /100 | #300 | Tragic $37,193 |
| Ottawa | 0.1 /100 | #301 | Tragic $37,101 |
| Shoshone | 0.1 /100 | #302 | Tragic $37,072 |
| Paiute | 0.1 /100 | #303 | Tragic $37,066 |
| Hondurans | 0.1 /100 | #304 | Tragic $37,031 |
| Inupiat | 0.1 /100 | #305 | Tragic $36,999 |
| Immigrants | Haiti | 0.0 /100 | #306 | Tragic $36,849 |
| Immigrants | Latin America | 0.0 /100 | #307 | Tragic $36,823 |
| Fijians | 0.0 /100 | #308 | Tragic $36,690 |
| Immigrants | Honduras | 0.0 /100 | #309 | Tragic $36,665 |
| Ute | 0.0 /100 | #310 | Tragic $36,651 |
| Chippewa | 0.0 /100 | #311 | Tragic $36,631 |
| Chickasaw | 0.0 /100 | #312 | Tragic $36,475 |
| Bahamians | 0.0 /100 | #313 | Tragic $36,427 |
| Seminole | 0.0 /100 | #314 | Tragic $36,180 |
| Yaqui | 0.0 /100 | #315 | Tragic $36,112 |
| Choctaw | 0.0 /100 | #316 | Tragic $35,999 |
| Dutch West Indians | 0.0 /100 | #317 | Tragic $35,922 |