Black/African American vs Immigrants from Caribbean Per Capita Income
COMPARE
Black/African American
Immigrants from Caribbean
Per Capita Income
Per Capita Income Comparison
Blacks/African Americans
Immigrants from Caribbean
$35,564
PER CAPITA INCOME
0.0/ 100
METRIC RATING
321st/ 347
METRIC RANK
$37,254
PER CAPITA INCOME
0.1/ 100
METRIC RATING
298th/ 347
METRIC RANK
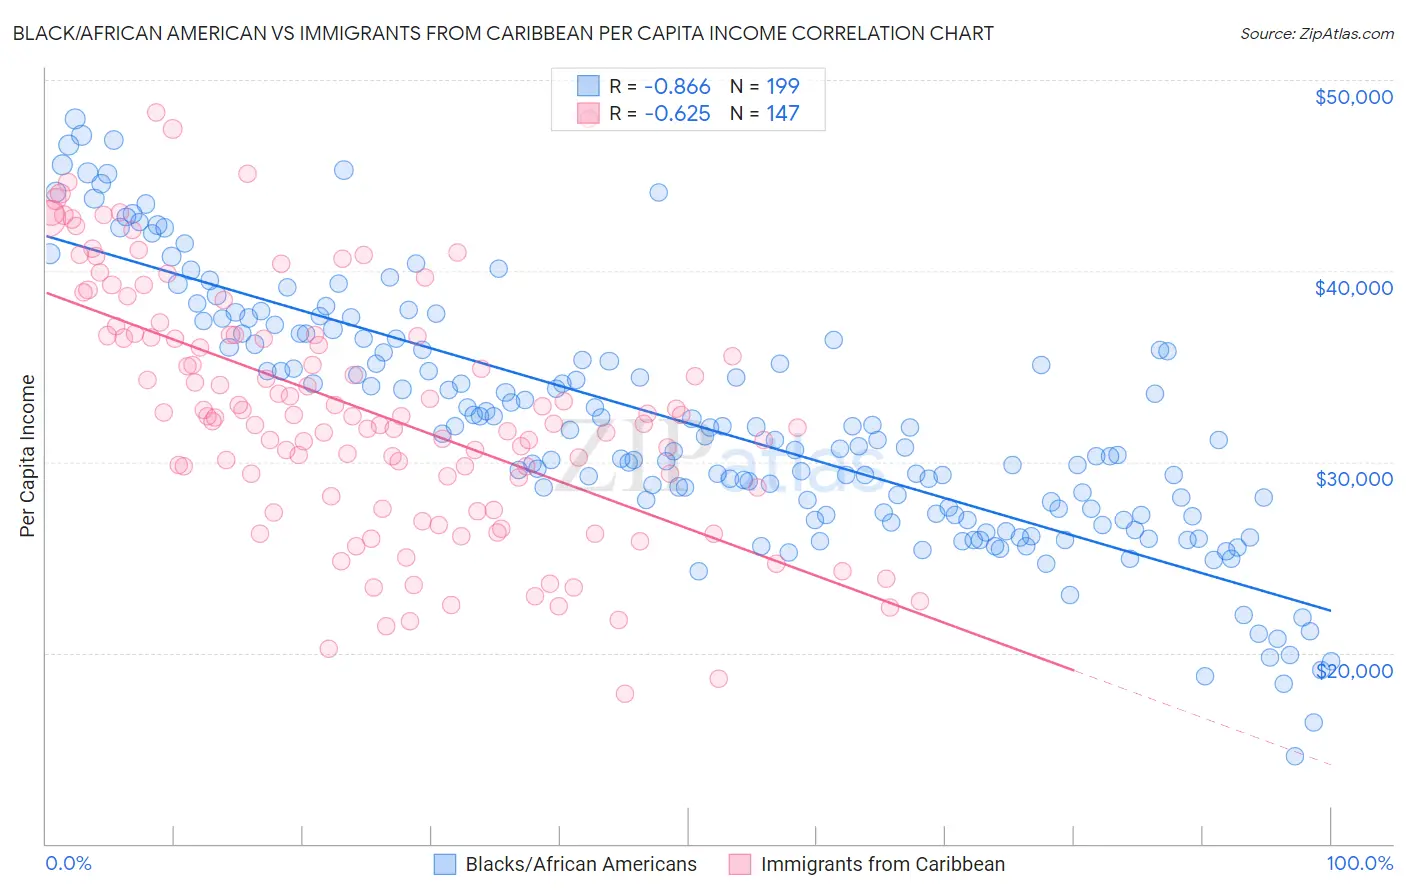
Black/African American vs Immigrants from Caribbean Per Capita Income Correlation Chart
The statistical analysis conducted on geographies consisting of 564,923,865 people shows a very strong negative correlation between the proportion of Blacks/African Americans and per capita income in the United States with a correlation coefficient (R) of -0.866 and weighted average of $35,564. Similarly, the statistical analysis conducted on geographies consisting of 450,065,292 people shows a significant negative correlation between the proportion of Immigrants from Caribbean and per capita income in the United States with a correlation coefficient (R) of -0.625 and weighted average of $37,254, a difference of 4.8%.
Per Capita Income Correlation Summary
| Measurement | Black/African American | Immigrants from Caribbean |
| Minimum | $14,598 | $17,858 |
| Maximum | $47,964 | $48,292 |
| Range | $33,366 | $30,434 |
| Mean | $32,008 | $32,742 |
| Median | $31,154 | $32,401 |
| Interquartile 25% (IQ1) | $27,216 | $28,636 |
| Interquartile 75% (IQ3) | $36,450 | $36,630 |
| Interquartile Range (IQR) | $9,234 | $7,994 |
| Standard Deviation (Sample) | $6,581 | $6,475 |
| Standard Deviation (Population) | $6,564 | $6,453 |
Similar Demographics by Per Capita Income
Demographics Similar to Blacks/African Americans by Per Capita Income
In terms of per capita income, the demographic groups most similar to Blacks/African Americans are Creek ($35,546, a difference of 0.050%), Hispanic or Latino ($35,688, a difference of 0.35%), Immigrants from Congo ($35,720, a difference of 0.44%), Cheyenne ($35,276, a difference of 0.82%), and Bangladeshi ($35,897, a difference of 0.94%).
| Demographics | Rating | Rank | Per Capita Income |
| Seminole | 0.0 /100 | #314 | Tragic $36,180 |
| Yaqui | 0.0 /100 | #315 | Tragic $36,112 |
| Choctaw | 0.0 /100 | #316 | Tragic $35,999 |
| Dutch West Indians | 0.0 /100 | #317 | Tragic $35,922 |
| Bangladeshis | 0.0 /100 | #318 | Tragic $35,897 |
| Immigrants | Congo | 0.0 /100 | #319 | Tragic $35,720 |
| Hispanics or Latinos | 0.0 /100 | #320 | Tragic $35,688 |
| Blacks/African Americans | 0.0 /100 | #321 | Tragic $35,564 |
| Creek | 0.0 /100 | #322 | Tragic $35,546 |
| Cheyenne | 0.0 /100 | #323 | Tragic $35,276 |
| Kiowa | 0.0 /100 | #324 | Tragic $35,102 |
| Immigrants | Central America | 0.0 /100 | #325 | Tragic $34,974 |
| Immigrants | Cuba | 0.0 /100 | #326 | Tragic $34,910 |
| Apache | 0.0 /100 | #327 | Tragic $34,886 |
| Menominee | 0.0 /100 | #328 | Tragic $34,578 |
Demographics Similar to Immigrants from Caribbean by Per Capita Income
In terms of per capita income, the demographic groups most similar to Immigrants from Caribbean are Haitian ($37,289, a difference of 0.090%), Indonesian ($37,300, a difference of 0.12%), Immigrants from Dominican Republic ($37,306, a difference of 0.14%), Cherokee ($37,203, a difference of 0.14%), and Immigrants from Bahamas ($37,193, a difference of 0.17%).
| Demographics | Rating | Rank | Per Capita Income |
| Cajuns | 0.1 /100 | #291 | Tragic $37,527 |
| Immigrants | Micronesia | 0.1 /100 | #292 | Tragic $37,464 |
| Mexican American Indians | 0.1 /100 | #293 | Tragic $37,407 |
| Cubans | 0.1 /100 | #294 | Tragic $37,383 |
| Immigrants | Dominican Republic | 0.1 /100 | #295 | Tragic $37,306 |
| Indonesians | 0.1 /100 | #296 | Tragic $37,300 |
| Haitians | 0.1 /100 | #297 | Tragic $37,289 |
| Immigrants | Caribbean | 0.1 /100 | #298 | Tragic $37,254 |
| Cherokee | 0.1 /100 | #299 | Tragic $37,203 |
| Immigrants | Bahamas | 0.1 /100 | #300 | Tragic $37,193 |
| Ottawa | 0.1 /100 | #301 | Tragic $37,101 |
| Shoshone | 0.1 /100 | #302 | Tragic $37,072 |
| Paiute | 0.1 /100 | #303 | Tragic $37,066 |
| Hondurans | 0.1 /100 | #304 | Tragic $37,031 |
| Inupiat | 0.1 /100 | #305 | Tragic $36,999 |