Aleut vs Immigrants from Caribbean Hearing Disability
COMPARE
Aleut
Immigrants from Caribbean
Hearing Disability
Hearing Disability Comparison
Aleuts
Immigrants from Caribbean
4.3%
HEARING DISABILITY
0.0/ 100
METRIC RATING
334th/ 347
METRIC RANK
2.6%
HEARING DISABILITY
99.7/ 100
METRIC RATING
30th/ 347
METRIC RANK
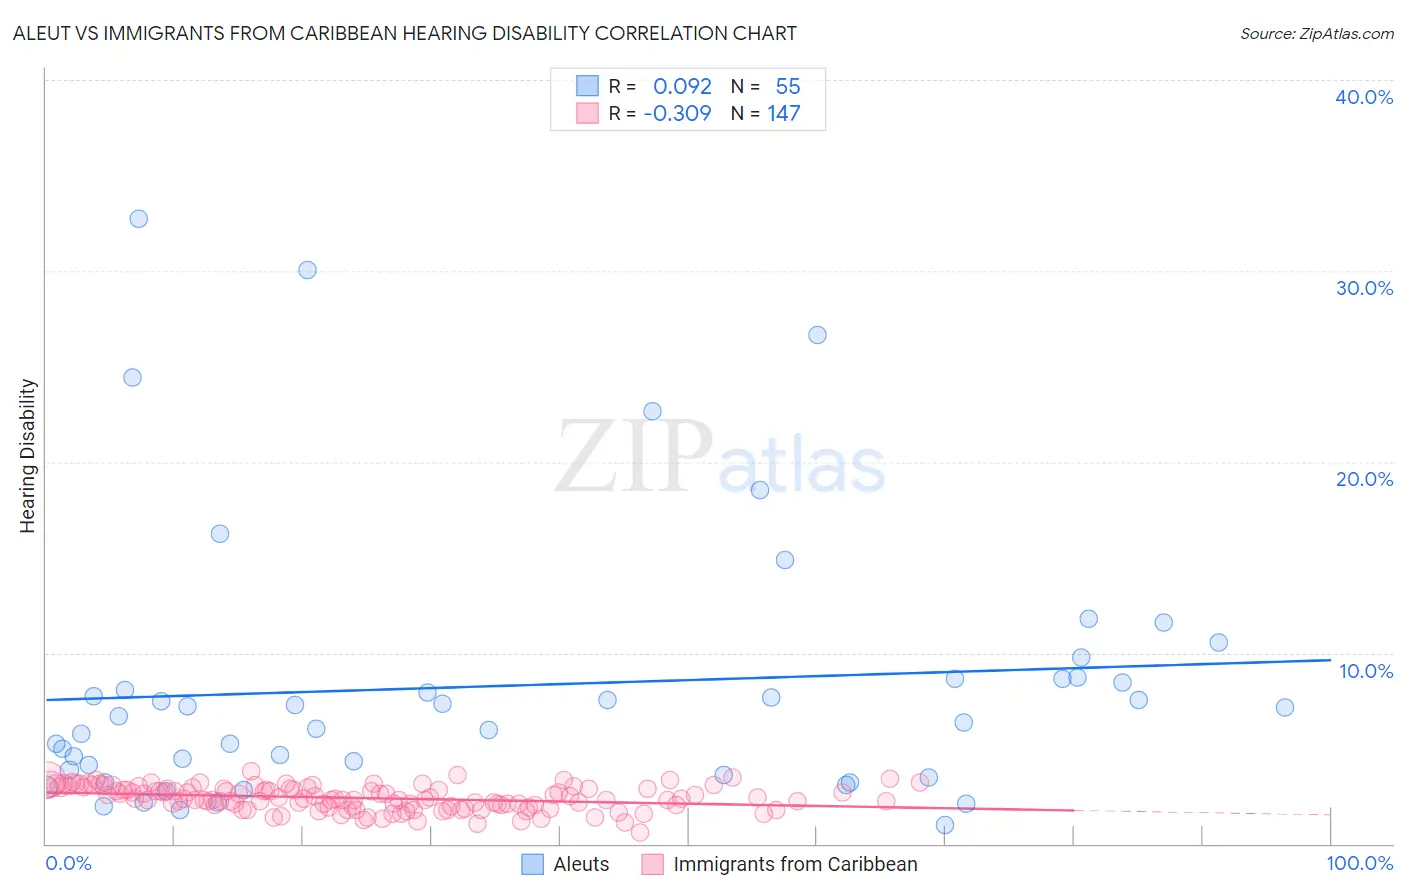
Aleut vs Immigrants from Caribbean Hearing Disability Correlation Chart
The statistical analysis conducted on geographies consisting of 61,781,709 people shows a slight positive correlation between the proportion of Aleuts and percentage of population with hearing disability in the United States with a correlation coefficient (R) of 0.092 and weighted average of 4.3%. Similarly, the statistical analysis conducted on geographies consisting of 449,729,133 people shows a mild negative correlation between the proportion of Immigrants from Caribbean and percentage of population with hearing disability in the United States with a correlation coefficient (R) of -0.309 and weighted average of 2.6%, a difference of 65.1%.
Hearing Disability Correlation Summary
| Measurement | Aleut | Immigrants from Caribbean |
| Minimum | 0.97% | 0.62% |
| Maximum | 32.7% | 3.8% |
| Range | 31.7% | 3.2% |
| Mean | 8.3% | 2.4% |
| Median | 6.7% | 2.4% |
| Interquartile 25% (IQ1) | 3.6% | 1.9% |
| Interquartile 75% (IQ3) | 8.6% | 2.9% |
| Interquartile Range (IQR) | 5.0% | 0.93% |
| Standard Deviation (Sample) | 7.1% | 0.62% |
| Standard Deviation (Population) | 7.1% | 0.62% |
Similar Demographics by Hearing Disability
Demographics Similar to Aleuts by Hearing Disability
In terms of hearing disability, the demographic groups most similar to Aleuts are Dutch West Indian (4.3%, a difference of 0.54%), Houma (4.2%, a difference of 1.1%), Kiowa (4.3%, a difference of 1.3%), Cherokee (4.2%, a difference of 1.8%), and Native/Alaskan (4.2%, a difference of 2.0%).
| Demographics | Rating | Rank | Hearing Disability |
| Arapaho | 0.0 /100 | #327 | Tragic 4.1% |
| Tohono O'odham | 0.0 /100 | #328 | Tragic 4.2% |
| Crow | 0.0 /100 | #329 | Tragic 4.2% |
| Natives/Alaskans | 0.0 /100 | #330 | Tragic 4.2% |
| Cherokee | 0.0 /100 | #331 | Tragic 4.2% |
| Houma | 0.0 /100 | #332 | Tragic 4.2% |
| Dutch West Indians | 0.0 /100 | #333 | Tragic 4.3% |
| Aleuts | 0.0 /100 | #334 | Tragic 4.3% |
| Kiowa | 0.0 /100 | #335 | Tragic 4.3% |
| Creek | 0.0 /100 | #336 | Tragic 4.4% |
| Chickasaw | 0.0 /100 | #337 | Tragic 4.5% |
| Alaska Natives | 0.0 /100 | #338 | Tragic 4.5% |
| Choctaw | 0.0 /100 | #339 | Tragic 4.5% |
| Pueblo | 0.0 /100 | #340 | Tragic 4.6% |
| Navajo | 0.0 /100 | #341 | Tragic 4.6% |
Demographics Similar to Immigrants from Caribbean by Hearing Disability
In terms of hearing disability, the demographic groups most similar to Immigrants from Caribbean are Immigrants from Cameroon (2.6%, a difference of 0.010%), Bolivian (2.6%, a difference of 0.080%), Immigrants from Haiti (2.6%, a difference of 0.10%), Immigrants from Venezuela (2.6%, a difference of 0.16%), and Filipino (2.6%, a difference of 0.42%).
| Demographics | Rating | Rank | Hearing Disability |
| Immigrants | Nigeria | 99.8 /100 | #23 | Exceptional 2.6% |
| Immigrants | Ghana | 99.8 /100 | #24 | Exceptional 2.6% |
| Immigrants | El Salvador | 99.7 /100 | #25 | Exceptional 2.6% |
| Immigrants | Senegal | 99.7 /100 | #26 | Exceptional 2.6% |
| Immigrants | South Central Asia | 99.7 /100 | #27 | Exceptional 2.6% |
| Immigrants | Haiti | 99.7 /100 | #28 | Exceptional 2.6% |
| Bolivians | 99.7 /100 | #29 | Exceptional 2.6% |
| Immigrants | Caribbean | 99.7 /100 | #30 | Exceptional 2.6% |
| Immigrants | Cameroon | 99.7 /100 | #31 | Exceptional 2.6% |
| Immigrants | Venezuela | 99.7 /100 | #32 | Exceptional 2.6% |
| Filipinos | 99.6 /100 | #33 | Exceptional 2.6% |
| Immigrants | Pakistan | 99.6 /100 | #34 | Exceptional 2.6% |
| Salvadorans | 99.6 /100 | #35 | Exceptional 2.6% |
| Okinawans | 99.6 /100 | #36 | Exceptional 2.6% |
| Immigrants | Western Africa | 99.6 /100 | #37 | Exceptional 2.6% |