Aleut vs Immigrants from Oceania Per Capita Income

COMPARE

Aleut
Race
Ancestry
AfghanAfricanAlaska NativeAlaskan AthabascanAlbanianAleutAlsatianAmericanApacheArabArapahoArgentineanArmenianAssyrian/Chaldean/SyriacAustralianAustrianBahamianBangladeshiBarbadianBasqueBelgianBelizeanBermudanBhutaneseBlackfeetBolivianBrazilianBritishBritish West IndianBulgarianBurmeseCajunCambodianCanadianCape VerdeanCarpatho RusynCelticCentral AmericanCentral American IndianCherokeeCheyenneChickasawChileanChineseChippewaChoctawColombianColvilleComancheCosta RicanCreeCreekCroatianCrowCubanCypriotCzechCzechoslovakianDanishDelawareDominicanDutchDutch West IndianEastern EuropeanEcuadorianEgyptianEnglishEstonianEthiopianEuropeanFijianFilipinoFinnishFrenchFrench American IndianFrench CanadianGermanGerman RussianGhanaianGreekGuamanian/ChamorroGuatemalanGuyaneseHaitianHmongHonduranHopiHoumaHungarianIcelanderIndian (Asian)IndonesianInupiatIranianIraqiIrishIroquoisIsraeliItalianJamaicanJapaneseJordanianKenyanKiowaKoreanLaotianLatvianLebaneseLiberianLithuanianLumbeeLuxembourgerMacedonianMalaysianMalteseMarshalleseMenomineeMexicanMexican American IndianMongolianMoroccanNative HawaiianNavajoNepaleseNew ZealanderNicaraguanNigerianNorthern EuropeanNorwegianOkinawanOsageOttawaPaiutePakistaniPalestinianPanamanianParaguayanPennsylvania GermanPeruvianPimaPolishPortuguesePotawatomiPuebloPuerto RicanPuget Sound SalishRomanianRussianSalvadoranSamoanScandinavianScotch-IrishScottishSeminoleSenegaleseSerbianShoshoneSierra LeoneanSiouxSlavicSlovakSloveneSomaliSouth AfricanSouth AmericanSouth American IndianSoviet UnionSpaniardSpanishSpanish AmericanSpanish American IndianSri LankanSubsaharan AfricanSudaneseSwedishSwissSyrianTaiwaneseThaiTlingit-HaidaTohono O'OdhamTonganTrinidadian and TobagonianTsimshianTurkishU.S. Virgin IslanderUgandanUkrainianUruguayanUteVenezuelanVietnameseWelshWest IndianYakamaYaquiYugoslavianYumanYup'ikZimbabwean
Immigration
NonimmigrantsImmigrantsAfghanistanAfricaAlbaniaArgentinaArmeniaAsiaAustraliaAustriaBahamasBangladeshBarbadosBelarusBelgiumBelizeBoliviaBosnia and HerzegovinaBrazilBulgariaBurma/MyanmarCabo VerdeCambodiaCameroonCanadaCaribbeanCentral AmericaChileChinaColombiaCongoCosta RicaCroatiaCubaCzechoslovakiaDenmarkDominicaDominican RepublicEastern AfricaEastern AsiaEastern EuropeEcuadorEgyptEl SalvadorEnglandEritreaEthiopiaEuropeFijiFranceGermanyGhanaGreeceGrenadaGuatemalaGuyanaHaitiHondurasHong KongHungaryIndiaIndonesiaIranIraqIrelandIsraelItalyJamaicaJapanJordanKazakhstanKenyaKoreaKuwaitLaosLatin AmericaLatviaLebanonLiberiaLithuaniaMalaysiaMexicoMicronesiaMiddle AfricaMoldovaMoroccoNepalNetherlandsNicaraguaNigeriaNorth AmericaNorth MacedoniaNorthern AfricaNorthern EuropeNorwayPakistanPanamaPeruPhilippinesPolandPortugalRomaniaRussiaSaudi ArabiaScotlandSenegalSerbiaSierra LeoneSingaporeSomaliaSouth AfricaSouth AmericaSouth Central AsiaSouth Eastern AsiaSouthern EuropeSpainSri LankaSt. Vincent and the GrenadinesSudanSwedenSwitzerlandSyriaTaiwanThailandTrinidad and TobagoTurkeyUgandaUkraineUruguayUzbekistanVenezuelaVietnamWest IndiesWestern AfricaWestern AsiaWestern EuropeYemenZaireZimbabweAzores
Immigrants from Oceania
Race
Ancestry
AfghanAfricanAlaska NativeAlaskan AthabascanAlbanianAlsatianAmericanApacheArabArapahoArgentineanArmenianAssyrian/Chaldean/SyriacAustralianAustrianBahamianBangladeshiBarbadianBasqueBelgianBelizeanBermudanBhutaneseBlackfeetBolivianBrazilianBritishBritish West IndianBulgarianBurmeseCajunCambodianCanadianCape VerdeanCarpatho RusynCelticCentral AmericanCentral American IndianCherokeeCheyenneChickasawChileanChineseChippewaChoctawColombianColvilleComancheCosta RicanCreeCreekCroatianCrowCubanCypriotCzechCzechoslovakianDanishDelawareDominicanDutchDutch West IndianEastern EuropeanEcuadorianEgyptianEnglishEstonianEthiopianEuropeanFijianFilipinoFinnishFrenchFrench American IndianFrench CanadianGermanGerman RussianGhanaianGreekGuamanian/ChamorroGuatemalanGuyaneseHaitianHmongHonduranHopiHoumaHungarianIcelanderIndian (Asian)IndonesianInupiatIranianIraqiIrishIroquoisIsraeliItalianJamaicanJapaneseJordanianKenyanKiowaKoreanLaotianLatvianLebaneseLiberianLithuanianLumbeeLuxembourgerMacedonianMalaysianMalteseMarshalleseMenomineeMexicanMexican American IndianMongolianMoroccanNative HawaiianNavajoNepaleseNew ZealanderNicaraguanNigerianNorthern EuropeanNorwegianOkinawanOsageOttawaPaiutePakistaniPalestinianPanamanianParaguayanPennsylvania GermanPeruvianPimaPolishPortuguesePotawatomiPuebloPuerto RicanPuget Sound SalishRomanianRussianSalvadoranSamoanScandinavianScotch-IrishScottishSeminoleSenegaleseSerbianShoshoneSierra LeoneanSiouxSlavicSlovakSloveneSomaliSouth AfricanSouth AmericanSouth American IndianSoviet UnionSpaniardSpanishSpanish AmericanSpanish American IndianSri LankanSubsaharan AfricanSudaneseSwedishSwissSyrianTaiwaneseThaiTlingit-HaidaTohono O'OdhamTonganTrinidadian and TobagonianTsimshianTurkishU.S. Virgin IslanderUgandanUkrainianUruguayanUteVenezuelanVietnameseWelshWest IndianYakamaYaquiYugoslavianYumanYup'ikZimbabwean
Immigration
NonimmigrantsImmigrantsAfghanistanAfricaAlbaniaArgentinaArmeniaAsiaAustraliaAustriaBahamasBangladeshBarbadosBelarusBelgiumBelizeBoliviaBosnia and HerzegovinaBrazilBulgariaBurma/MyanmarCabo VerdeCambodiaCameroonCanadaCaribbeanCentral AmericaChileChinaColombiaCongoCosta RicaCroatiaCubaCzechoslovakiaDenmarkDominicaDominican RepublicEastern AfricaEastern AsiaEastern EuropeEcuadorEgyptEl SalvadorEnglandEritreaEthiopiaEuropeFijiFranceGermanyGhanaGreeceGrenadaGuatemalaGuyanaHaitiHondurasHong KongHungaryIndiaIndonesiaIranIraqIrelandIsraelItalyJamaicaJapanJordanKazakhstanKenyaKoreaKuwaitLaosLatin AmericaLatviaLebanonLiberiaLithuaniaMalaysiaMexicoMicronesiaMiddle AfricaMoldovaMoroccoNepalNetherlandsNicaraguaNigeriaNorth AmericaNorth MacedoniaNorthern AfricaNorthern EuropeNorwayOceaniaPakistanPanamaPeruPhilippinesPolandPortugalRomaniaRussiaSaudi ArabiaScotlandSenegalSerbiaSierra LeoneSingaporeSomaliaSouth AfricaSouth AmericaSouth Central AsiaSouth Eastern AsiaSouthern EuropeSpainSri LankaSt. Vincent and the GrenadinesSudanSwedenSwitzerlandSyriaTaiwanThailandTrinidad and TobagoTurkeyUgandaUkraineUruguayUzbekistanVenezuelaVietnamWest IndiesWestern AfricaWestern AsiaWestern EuropeYemenZaireZimbabweAzores
Per Capita Income
Income
Poverty
Unemployment
Labor Participation
Family Structure
Vehicle Availability
Education Level
Disability

Per Capita Income Comparison

Aleuts

Immigrants from Oceania

Poor
Excellent
$42,210
PER CAPITA INCOME
16.4/ 100
METRIC RATING
204th/ 347
METRIC RANK
$45,220
PER CAPITA INCOME
85.2/ 100
METRIC RATING
136th/ 347
METRIC RANK

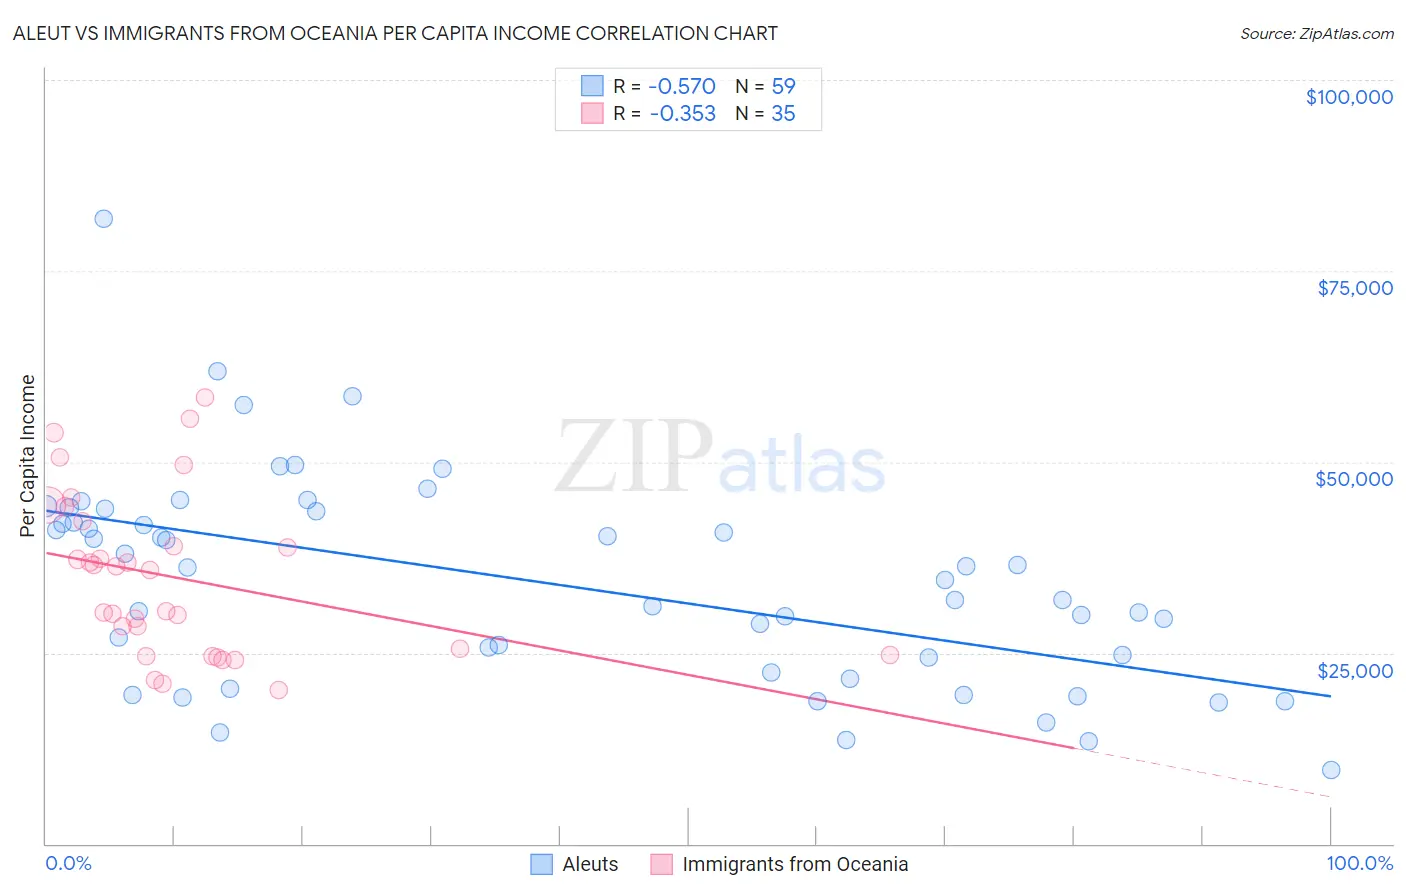
Aleut vs Immigrants from Oceania Per Capita Income Correlation Chart

The statistical analysis conducted on geographies consisting of 61,782,949 people shows a substantial negative correlation between the proportion of Aleuts and per capita income in the United States with a correlation coefficient (R) of -0.570 and weighted average of $42,210. Similarly, the statistical analysis conducted on geographies consisting of 305,528,367 people shows a mild negative correlation between the proportion of Immigrants from Oceania and per capita income in the United States with a correlation coefficient (R) of -0.353 and weighted average of $45,220, a difference of 7.1%.
Aleut vs Immigrants from Oceania Per Capita Income

Per Capita Income Correlation Summary

MeasurementAleutImmigrants from Oceania
Minimum$9,575$20,128
Maximum$81,877$58,378
Range$72,302$38,250
Mean$34,258$34,877
Median$34,500$35,881
Interquartile 25% (IQ1)$22,490$24,699
Interquartile 75% (IQ3)$43,602$42,218
Interquartile Range (IQR)$21,112$17,519
Standard Deviation (Sample)$13,784$10,480
Standard Deviation (Population)$13,667$10,330

Similar Demographics by Per Capita Income

Demographics Similar to Aleuts by Per Capita Income

In terms of per capita income, the demographic groups most similar to Aleuts are White/Caucasian ($42,180, a difference of 0.070%), Spanish ($42,249, a difference of 0.090%), Ghanaian ($42,164, a difference of 0.11%), Immigrants from Bosnia and Herzegovina ($42,278, a difference of 0.16%), and Immigrants from Thailand ($42,289, a difference of 0.19%).
DemographicsRating | RankPer Capita Income
Scotch-Irish
22.6
/100
|
#197
Fair
$42,563
Immigrants | Portugal
19.7
/100
|
#198
Poor
$42,412
Barbadians
19.6
/100
|
#199
Poor
$42,406
Vietnamese
19.0
/100
|
#200
Poor
$42,368
Immigrants | Thailand
17.6
/100
|
#201
Poor
$42,289
Immigrants | Bosnia and Herzegovina
17.5
/100
|
#202
Poor
$42,278
Spanish
17.0
/100
|
#203
Poor
$42,249
Aleuts
16.4
/100
|
#204
Poor
$42,210
Whites/Caucasians
15.9
/100
|
#205
Poor
$42,180
Ghanaians
15.7
/100
|
#206
Poor
$42,164
Venezuelans
14.4
/100
|
#207
Poor
$42,074
Panamanians
13.9
/100
|
#208
Poor
$42,035
Immigrants | Sudan
13.2
/100
|
#209
Poor
$41,986
Ecuadorians
12.9
/100
|
#210
Poor
$41,958
Immigrants | Panama
11.6
/100
|
#211
Poor
$41,853

Demographics Similar to Immigrants from Oceania by Per Capita Income

In terms of per capita income, the demographic groups most similar to Immigrants from Oceania are Immigrants from Syria ($45,218, a difference of 0.0%), Assyrian/Chaldean/Syriac ($45,195, a difference of 0.060%), Basque ($45,086, a difference of 0.30%), Immigrants from Jordan ($45,066, a difference of 0.34%), and Slavic ($45,049, a difference of 0.38%).
DemographicsRating | RankPer Capita Income
Luxembourgers
90.4
/100
|
#129
Exceptional
$45,663
Arabs
90.4
/100
|
#130
Exceptional
$45,662
Immigrants | North Macedonia
90.0
/100
|
#131
Exceptional
$45,622
Jordanians
89.9
/100
|
#132
Excellent
$45,605
Pakistanis
89.7
/100
|
#133
Excellent
$45,587
Slovenes
89.6
/100
|
#134
Excellent
$45,581
Hungarians
87.9
/100
|
#135
Excellent
$45,426
Immigrants | Oceania
85.2
/100
|
#136
Excellent
$45,220
Immigrants | Syria
85.2
/100
|
#137
Excellent
$45,218
Assyrians/Chaldeans/Syriacs
84.8
/100
|
#138
Excellent
$45,195
Basques
83.2
/100
|
#139
Excellent
$45,086
Immigrants | Jordan
82.9
/100
|
#140
Excellent
$45,066
Slavs
82.6
/100
|
#141
Excellent
$45,049
Ugandans
82.6
/100
|
#142
Excellent
$45,047
Immigrants | Uganda
82.5
/100
|
#143
Excellent
$45,043