Albanian vs Immigrants from Serbia Median Female Earnings
COMPARE
Albanian
Immigrants from Serbia
Median Female Earnings
Median Female Earnings Comparison
Albanians
Immigrants from Serbia
$42,584
MEDIAN FEMALE EARNINGS
99.8/ 100
METRIC RATING
72nd/ 347
METRIC RANK
$43,385
MEDIAN FEMALE EARNINGS
100.0/ 100
METRIC RATING
49th/ 347
METRIC RANK
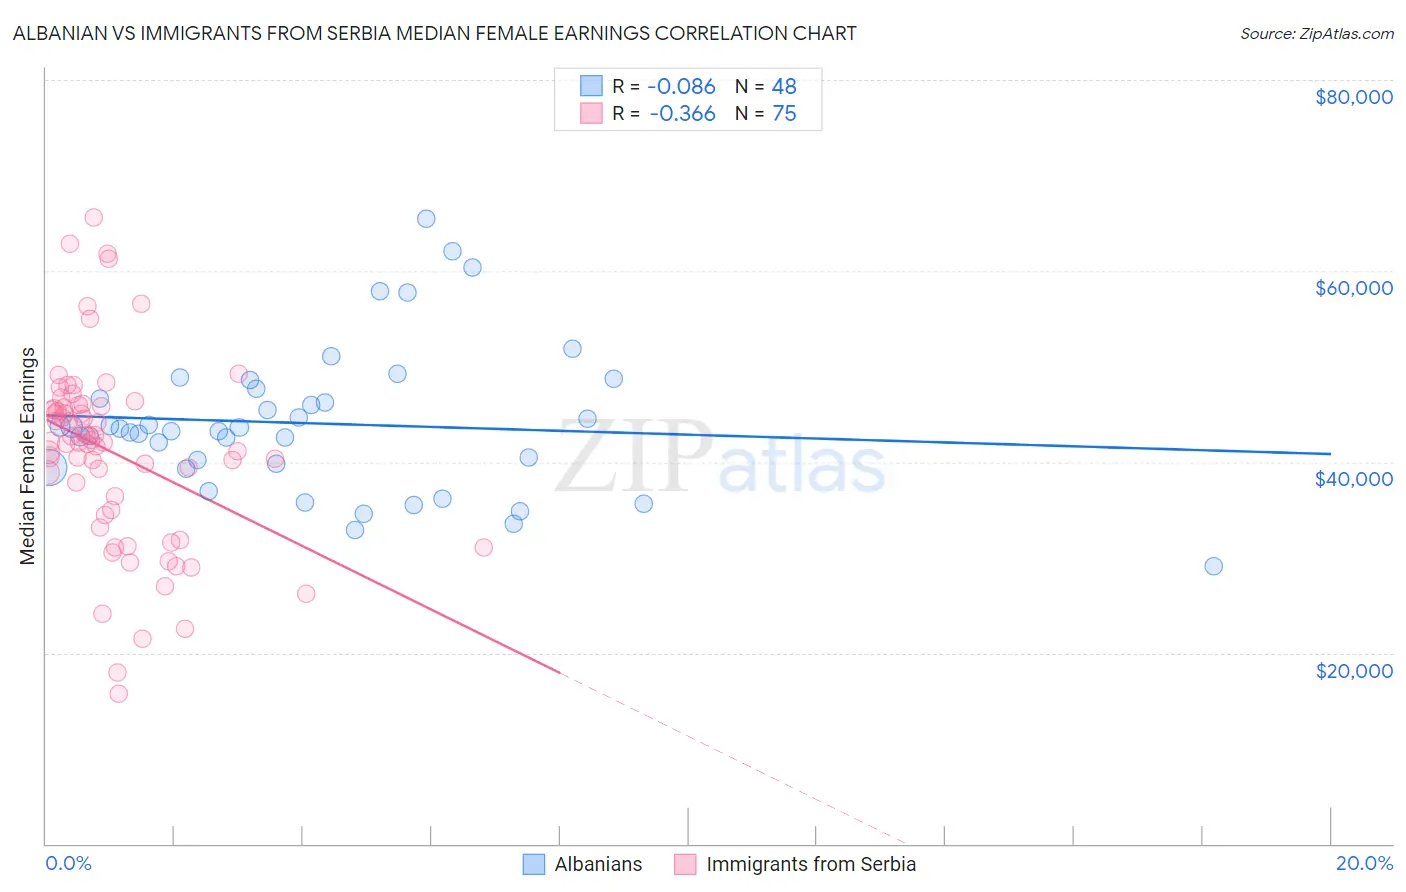
Albanian vs Immigrants from Serbia Median Female Earnings Correlation Chart
The statistical analysis conducted on geographies consisting of 193,224,752 people shows a slight negative correlation between the proportion of Albanians and median female earnings in the United States with a correlation coefficient (R) of -0.086 and weighted average of $42,584. Similarly, the statistical analysis conducted on geographies consisting of 131,728,260 people shows a mild negative correlation between the proportion of Immigrants from Serbia and median female earnings in the United States with a correlation coefficient (R) of -0.366 and weighted average of $43,385, a difference of 1.9%.
Median Female Earnings Correlation Summary
| Measurement | Albanian | Immigrants from Serbia |
| Minimum | $29,043 | $15,750 |
| Maximum | $65,406 | $65,545 |
| Range | $36,363 | $49,795 |
| Mean | $44,026 | $40,928 |
| Median | $43,361 | $42,089 |
| Interquartile 25% (IQ1) | $39,614 | $34,470 |
| Interquartile 75% (IQ3) | $47,094 | $45,867 |
| Interquartile Range (IQR) | $7,480 | $11,397 |
| Standard Deviation (Sample) | $7,618 | $9,877 |
| Standard Deviation (Population) | $7,538 | $9,811 |
Similar Demographics by Median Female Earnings
Demographics Similar to Albanians by Median Female Earnings
In terms of median female earnings, the demographic groups most similar to Albanians are Mongolian ($42,542, a difference of 0.10%), Immigrants from South Africa ($42,508, a difference of 0.18%), Immigrants from Romania ($42,718, a difference of 0.32%), New Zealander ($42,446, a difference of 0.32%), and Immigrants from Italy ($42,446, a difference of 0.33%).
| Demographics | Rating | Rank | Median Female Earnings |
| Sierra Leoneans | 99.9 /100 | #65 | Exceptional $42,868 |
| Immigrants | Norway | 99.9 /100 | #66 | Exceptional $42,837 |
| Immigrants | Egypt | 99.9 /100 | #67 | Exceptional $42,837 |
| Immigrants | Austria | 99.8 /100 | #68 | Exceptional $42,824 |
| Immigrants | Spain | 99.8 /100 | #69 | Exceptional $42,815 |
| Immigrants | Ethiopia | 99.8 /100 | #70 | Exceptional $42,744 |
| Immigrants | Romania | 99.8 /100 | #71 | Exceptional $42,718 |
| Albanians | 99.8 /100 | #72 | Exceptional $42,584 |
| Mongolians | 99.7 /100 | #73 | Exceptional $42,542 |
| Immigrants | South Africa | 99.7 /100 | #74 | Exceptional $42,508 |
| New Zealanders | 99.7 /100 | #75 | Exceptional $42,446 |
| Immigrants | Italy | 99.7 /100 | #76 | Exceptional $42,446 |
| Immigrants | Albania | 99.6 /100 | #77 | Exceptional $42,388 |
| Immigrants | Kazakhstan | 99.6 /100 | #78 | Exceptional $42,386 |
| Greeks | 99.6 /100 | #79 | Exceptional $42,336 |
Demographics Similar to Immigrants from Serbia by Median Female Earnings
In terms of median female earnings, the demographic groups most similar to Immigrants from Serbia are Immigrants from Uzbekistan ($43,363, a difference of 0.050%), Immigrants from Indonesia ($43,412, a difference of 0.060%), Maltese ($43,357, a difference of 0.060%), Bolivian ($43,445, a difference of 0.14%), and Immigrants from Lithuania ($43,317, a difference of 0.16%).
| Demographics | Rating | Rank | Median Female Earnings |
| Immigrants | Denmark | 100.0 /100 | #42 | Exceptional $43,646 |
| Bulgarians | 100.0 /100 | #43 | Exceptional $43,638 |
| Immigrants | Czechoslovakia | 100.0 /100 | #44 | Exceptional $43,571 |
| Immigrants | Europe | 100.0 /100 | #45 | Exceptional $43,523 |
| Immigrants | Bolivia | 100.0 /100 | #46 | Exceptional $43,467 |
| Bolivians | 100.0 /100 | #47 | Exceptional $43,445 |
| Immigrants | Indonesia | 100.0 /100 | #48 | Exceptional $43,412 |
| Immigrants | Serbia | 100.0 /100 | #49 | Exceptional $43,385 |
| Immigrants | Uzbekistan | 100.0 /100 | #50 | Exceptional $43,363 |
| Maltese | 100.0 /100 | #51 | Exceptional $43,357 |
| Immigrants | Lithuania | 99.9 /100 | #52 | Exceptional $43,317 |
| Immigrants | Eastern Europe | 99.9 /100 | #53 | Exceptional $43,309 |
| Australians | 99.9 /100 | #54 | Exceptional $43,308 |
| Egyptians | 99.9 /100 | #55 | Exceptional $43,305 |
| Immigrants | Croatia | 99.9 /100 | #56 | Exceptional $43,258 |