Albanian vs Immigrants from Serbia Cognitive Disability
COMPARE
Albanian
Immigrants from Serbia
Cognitive Disability
Cognitive Disability Comparison
Albanians
Immigrants from Serbia
16.8%
COGNITIVE DISABILITY
97.3/ 100
METRIC RATING
109th/ 347
METRIC RANK
16.7%
COGNITIVE DISABILITY
99.3/ 100
METRIC RATING
76th/ 347
METRIC RANK
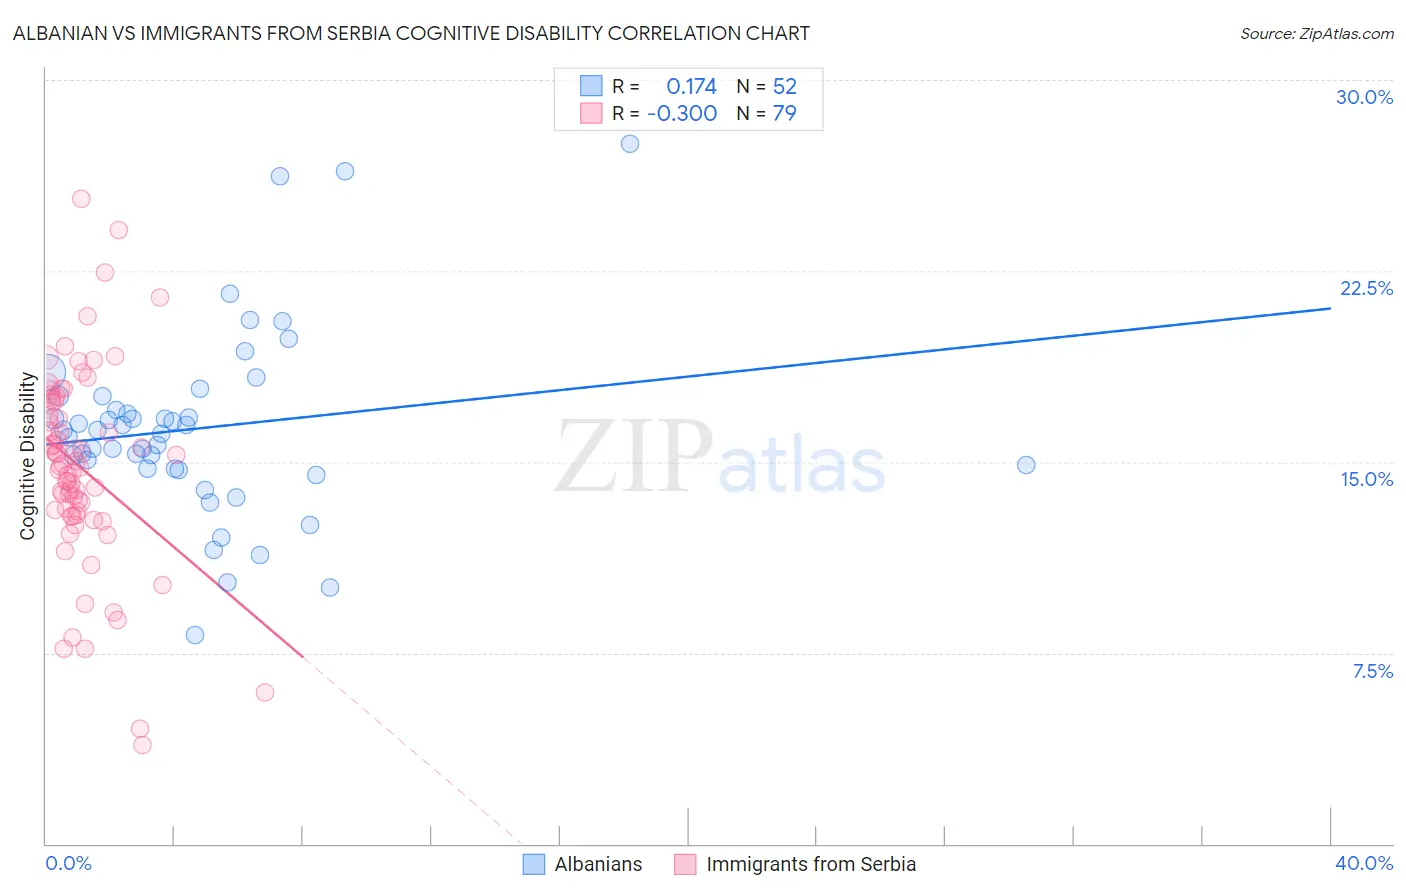
Albanian vs Immigrants from Serbia Cognitive Disability Correlation Chart
The statistical analysis conducted on geographies consisting of 193,265,298 people shows a poor positive correlation between the proportion of Albanians and percentage of population with cognitive disability in the United States with a correlation coefficient (R) of 0.174 and weighted average of 16.8%. Similarly, the statistical analysis conducted on geographies consisting of 131,747,829 people shows a mild negative correlation between the proportion of Immigrants from Serbia and percentage of population with cognitive disability in the United States with a correlation coefficient (R) of -0.300 and weighted average of 16.7%, a difference of 1.0%.
Cognitive Disability Correlation Summary
| Measurement | Albanian | Immigrants from Serbia |
| Minimum | 8.2% | 3.9% |
| Maximum | 27.5% | 25.3% |
| Range | 19.3% | 21.5% |
| Mean | 16.3% | 14.8% |
| Median | 16.2% | 14.9% |
| Interquartile 25% (IQ1) | 14.7% | 12.9% |
| Interquartile 75% (IQ3) | 17.3% | 17.4% |
| Interquartile Range (IQR) | 2.6% | 4.5% |
| Standard Deviation (Sample) | 3.7% | 3.9% |
| Standard Deviation (Population) | 3.6% | 3.9% |
Similar Demographics by Cognitive Disability
Demographics Similar to Albanians by Cognitive Disability
In terms of cognitive disability, the demographic groups most similar to Albanians are Arapaho (16.8%, a difference of 0.010%), Uruguayan (16.8%, a difference of 0.020%), Indian (Asian) (16.8%, a difference of 0.040%), Canadian (16.8%, a difference of 0.050%), and Immigrants from Sri Lanka (16.8%, a difference of 0.050%).
| Demographics | Rating | Rank | Cognitive Disability |
| Irish | 98.1 /100 | #102 | Exceptional 16.8% |
| Paraguayans | 98.0 /100 | #103 | Exceptional 16.8% |
| Palestinians | 98.0 /100 | #104 | Exceptional 16.8% |
| Immigrants | Eastern Asia | 97.9 /100 | #105 | Exceptional 16.8% |
| Northern Europeans | 97.8 /100 | #106 | Exceptional 16.8% |
| Immigrants | Nicaragua | 97.8 /100 | #107 | Exceptional 16.8% |
| Canadians | 97.5 /100 | #108 | Exceptional 16.8% |
| Albanians | 97.3 /100 | #109 | Exceptional 16.8% |
| Arapaho | 97.3 /100 | #110 | Exceptional 16.8% |
| Uruguayans | 97.2 /100 | #111 | Exceptional 16.8% |
| Indians (Asian) | 97.2 /100 | #112 | Exceptional 16.8% |
| Immigrants | Sri Lanka | 97.1 /100 | #113 | Exceptional 16.8% |
| Koreans | 97.1 /100 | #114 | Exceptional 16.8% |
| Yup'ik | 96.9 /100 | #115 | Exceptional 16.9% |
| Inupiat | 96.5 /100 | #116 | Exceptional 16.9% |
Demographics Similar to Immigrants from Serbia by Cognitive Disability
In terms of cognitive disability, the demographic groups most similar to Immigrants from Serbia are Immigrants from Hungary (16.7%, a difference of 0.010%), Peruvian (16.7%, a difference of 0.010%), Estonian (16.7%, a difference of 0.020%), Immigrants from Bulgaria (16.7%, a difference of 0.020%), and Burmese (16.7%, a difference of 0.030%).
| Demographics | Rating | Rank | Cognitive Disability |
| Immigrants | Uzbekistan | 99.4 /100 | #69 | Exceptional 16.7% |
| Immigrants | Sweden | 99.4 /100 | #70 | Exceptional 16.7% |
| Immigrants | Belgium | 99.3 /100 | #71 | Exceptional 16.7% |
| Germans | 99.3 /100 | #72 | Exceptional 16.7% |
| Burmese | 99.3 /100 | #73 | Exceptional 16.7% |
| Slavs | 99.3 /100 | #74 | Exceptional 16.7% |
| Estonians | 99.3 /100 | #75 | Exceptional 16.7% |
| Immigrants | Serbia | 99.3 /100 | #76 | Exceptional 16.7% |
| Immigrants | Hungary | 99.3 /100 | #77 | Exceptional 16.7% |
| Peruvians | 99.3 /100 | #78 | Exceptional 16.7% |
| Immigrants | Bulgaria | 99.3 /100 | #79 | Exceptional 16.7% |
| Egyptians | 99.2 /100 | #80 | Exceptional 16.7% |
| Immigrants | Netherlands | 99.2 /100 | #81 | Exceptional 16.7% |
| Swiss | 99.2 /100 | #82 | Exceptional 16.7% |
| Serbians | 99.1 /100 | #83 | Exceptional 16.7% |