Cherokee vs Immigrants from Serbia Median Female Earnings
COMPARE
Cherokee
Immigrants from Serbia
Median Female Earnings
Median Female Earnings Comparison
Cherokee
Immigrants from Serbia
$34,742
MEDIAN FEMALE EARNINGS
0.0/ 100
METRIC RATING
316th/ 347
METRIC RANK
$43,385
MEDIAN FEMALE EARNINGS
100.0/ 100
METRIC RATING
49th/ 347
METRIC RANK
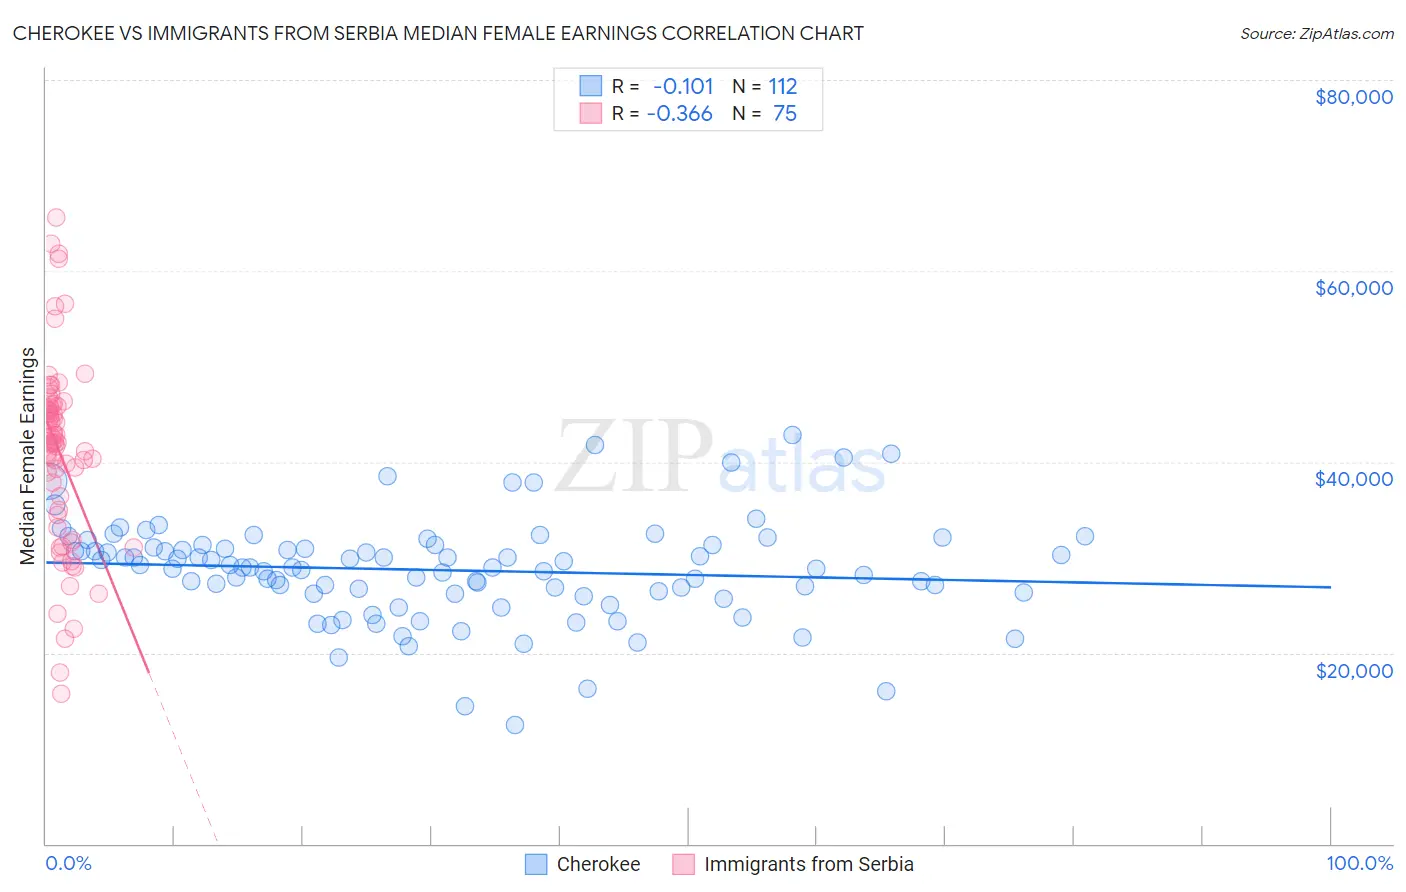
Cherokee vs Immigrants from Serbia Median Female Earnings Correlation Chart
The statistical analysis conducted on geographies consisting of 492,961,195 people shows a poor negative correlation between the proportion of Cherokee and median female earnings in the United States with a correlation coefficient (R) of -0.101 and weighted average of $34,742. Similarly, the statistical analysis conducted on geographies consisting of 131,728,260 people shows a mild negative correlation between the proportion of Immigrants from Serbia and median female earnings in the United States with a correlation coefficient (R) of -0.366 and weighted average of $43,385, a difference of 24.9%.
Median Female Earnings Correlation Summary
| Measurement | Cherokee | Immigrants from Serbia |
| Minimum | $12,396 | $15,750 |
| Maximum | $42,750 | $65,545 |
| Range | $30,354 | $49,795 |
| Mean | $28,662 | $40,928 |
| Median | $28,960 | $42,089 |
| Interquartile 25% (IQ1) | $26,268 | $34,470 |
| Interquartile 75% (IQ3) | $31,156 | $45,867 |
| Interquartile Range (IQR) | $4,888 | $11,397 |
| Standard Deviation (Sample) | $5,298 | $9,877 |
| Standard Deviation (Population) | $5,275 | $9,811 |
Similar Demographics by Median Female Earnings
Demographics Similar to Cherokee by Median Female Earnings
In terms of median female earnings, the demographic groups most similar to Cherokee are Potawatomi ($34,739, a difference of 0.010%), Immigrants from Yemen ($34,693, a difference of 0.14%), Pennsylvania German ($34,802, a difference of 0.17%), Shoshone ($34,677, a difference of 0.19%), and Immigrants from Honduras ($34,647, a difference of 0.27%).
| Demographics | Rating | Rank | Median Female Earnings |
| Hondurans | 0.0 /100 | #309 | Tragic $35,013 |
| Chippewa | 0.0 /100 | #310 | Tragic $35,003 |
| Ute | 0.0 /100 | #311 | Tragic $34,960 |
| Yaqui | 0.0 /100 | #312 | Tragic $34,943 |
| Cubans | 0.0 /100 | #313 | Tragic $34,942 |
| Apache | 0.0 /100 | #314 | Tragic $34,895 |
| Pennsylvania Germans | 0.0 /100 | #315 | Tragic $34,802 |
| Cherokee | 0.0 /100 | #316 | Tragic $34,742 |
| Potawatomi | 0.0 /100 | #317 | Tragic $34,739 |
| Immigrants | Yemen | 0.0 /100 | #318 | Tragic $34,693 |
| Shoshone | 0.0 /100 | #319 | Tragic $34,677 |
| Immigrants | Honduras | 0.0 /100 | #320 | Tragic $34,647 |
| Hispanics or Latinos | 0.0 /100 | #321 | Tragic $34,421 |
| Chickasaw | 0.0 /100 | #322 | Tragic $34,414 |
| Seminole | 0.0 /100 | #323 | Tragic $34,385 |
Demographics Similar to Immigrants from Serbia by Median Female Earnings
In terms of median female earnings, the demographic groups most similar to Immigrants from Serbia are Immigrants from Uzbekistan ($43,363, a difference of 0.050%), Immigrants from Indonesia ($43,412, a difference of 0.060%), Maltese ($43,357, a difference of 0.060%), Bolivian ($43,445, a difference of 0.14%), and Immigrants from Lithuania ($43,317, a difference of 0.16%).
| Demographics | Rating | Rank | Median Female Earnings |
| Immigrants | Denmark | 100.0 /100 | #42 | Exceptional $43,646 |
| Bulgarians | 100.0 /100 | #43 | Exceptional $43,638 |
| Immigrants | Czechoslovakia | 100.0 /100 | #44 | Exceptional $43,571 |
| Immigrants | Europe | 100.0 /100 | #45 | Exceptional $43,523 |
| Immigrants | Bolivia | 100.0 /100 | #46 | Exceptional $43,467 |
| Bolivians | 100.0 /100 | #47 | Exceptional $43,445 |
| Immigrants | Indonesia | 100.0 /100 | #48 | Exceptional $43,412 |
| Immigrants | Serbia | 100.0 /100 | #49 | Exceptional $43,385 |
| Immigrants | Uzbekistan | 100.0 /100 | #50 | Exceptional $43,363 |
| Maltese | 100.0 /100 | #51 | Exceptional $43,357 |
| Immigrants | Lithuania | 99.9 /100 | #52 | Exceptional $43,317 |
| Immigrants | Eastern Europe | 99.9 /100 | #53 | Exceptional $43,309 |
| Australians | 99.9 /100 | #54 | Exceptional $43,308 |
| Egyptians | 99.9 /100 | #55 | Exceptional $43,305 |
| Immigrants | Croatia | 99.9 /100 | #56 | Exceptional $43,258 |