Albanian vs Immigrants from Nepal Median Female Earnings
COMPARE
Albanian
Immigrants from Nepal
Median Female Earnings
Median Female Earnings Comparison
Albanians
Immigrants from Nepal
$42,584
MEDIAN FEMALE EARNINGS
99.8/ 100
METRIC RATING
72nd/ 347
METRIC RANK
$40,704
MEDIAN FEMALE EARNINGS
89.0/ 100
METRIC RATING
135th/ 347
METRIC RANK
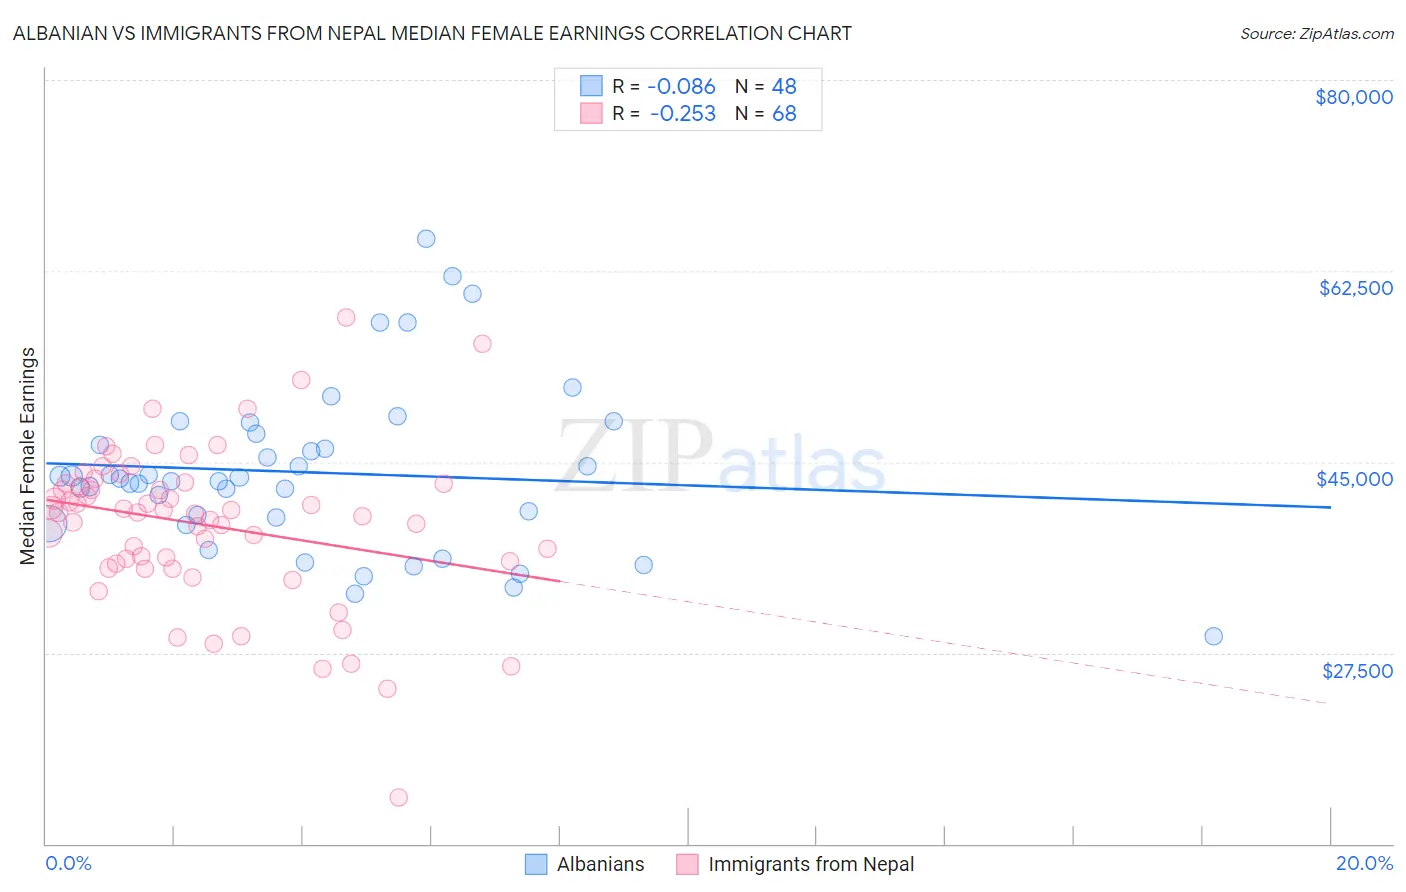
Albanian vs Immigrants from Nepal Median Female Earnings Correlation Chart
The statistical analysis conducted on geographies consisting of 193,224,752 people shows a slight negative correlation between the proportion of Albanians and median female earnings in the United States with a correlation coefficient (R) of -0.086 and weighted average of $42,584. Similarly, the statistical analysis conducted on geographies consisting of 186,777,709 people shows a weak negative correlation between the proportion of Immigrants from Nepal and median female earnings in the United States with a correlation coefficient (R) of -0.253 and weighted average of $40,704, a difference of 4.6%.
Median Female Earnings Correlation Summary
| Measurement | Albanian | Immigrants from Nepal |
| Minimum | $29,043 | $14,200 |
| Maximum | $65,406 | $58,230 |
| Range | $36,363 | $44,030 |
| Mean | $44,026 | $39,241 |
| Median | $43,361 | $40,353 |
| Interquartile 25% (IQ1) | $39,614 | $35,758 |
| Interquartile 75% (IQ3) | $47,094 | $43,011 |
| Interquartile Range (IQR) | $7,480 | $7,253 |
| Standard Deviation (Sample) | $7,618 | $7,300 |
| Standard Deviation (Population) | $7,538 | $7,246 |
Similar Demographics by Median Female Earnings
Demographics Similar to Albanians by Median Female Earnings
In terms of median female earnings, the demographic groups most similar to Albanians are Mongolian ($42,542, a difference of 0.10%), Immigrants from South Africa ($42,508, a difference of 0.18%), Immigrants from Romania ($42,718, a difference of 0.32%), New Zealander ($42,446, a difference of 0.32%), and Immigrants from Italy ($42,446, a difference of 0.33%).
| Demographics | Rating | Rank | Median Female Earnings |
| Sierra Leoneans | 99.9 /100 | #65 | Exceptional $42,868 |
| Immigrants | Norway | 99.9 /100 | #66 | Exceptional $42,837 |
| Immigrants | Egypt | 99.9 /100 | #67 | Exceptional $42,837 |
| Immigrants | Austria | 99.8 /100 | #68 | Exceptional $42,824 |
| Immigrants | Spain | 99.8 /100 | #69 | Exceptional $42,815 |
| Immigrants | Ethiopia | 99.8 /100 | #70 | Exceptional $42,744 |
| Immigrants | Romania | 99.8 /100 | #71 | Exceptional $42,718 |
| Albanians | 99.8 /100 | #72 | Exceptional $42,584 |
| Mongolians | 99.7 /100 | #73 | Exceptional $42,542 |
| Immigrants | South Africa | 99.7 /100 | #74 | Exceptional $42,508 |
| New Zealanders | 99.7 /100 | #75 | Exceptional $42,446 |
| Immigrants | Italy | 99.7 /100 | #76 | Exceptional $42,446 |
| Immigrants | Albania | 99.6 /100 | #77 | Exceptional $42,388 |
| Immigrants | Kazakhstan | 99.6 /100 | #78 | Exceptional $42,386 |
| Greeks | 99.6 /100 | #79 | Exceptional $42,336 |
Demographics Similar to Immigrants from Nepal by Median Female Earnings
In terms of median female earnings, the demographic groups most similar to Immigrants from Nepal are Arab ($40,718, a difference of 0.030%), Syrian ($40,727, a difference of 0.060%), Immigrants from Uganda ($40,739, a difference of 0.090%), Chilean ($40,757, a difference of 0.13%), and Immigrants from Eastern Africa ($40,644, a difference of 0.15%).
| Demographics | Rating | Rank | Median Female Earnings |
| Carpatho Rusyns | 91.2 /100 | #128 | Exceptional $40,825 |
| Zimbabweans | 90.8 /100 | #129 | Exceptional $40,798 |
| Immigrants | Guyana | 90.3 /100 | #130 | Exceptional $40,773 |
| Chileans | 90.0 /100 | #131 | Exceptional $40,757 |
| Immigrants | Uganda | 89.7 /100 | #132 | Excellent $40,739 |
| Syrians | 89.5 /100 | #133 | Excellent $40,727 |
| Arabs | 89.3 /100 | #134 | Excellent $40,718 |
| Immigrants | Nepal | 89.0 /100 | #135 | Excellent $40,704 |
| Immigrants | Eastern Africa | 87.7 /100 | #136 | Excellent $40,644 |
| Pakistanis | 86.6 /100 | #137 | Excellent $40,596 |
| Taiwanese | 86.1 /100 | #138 | Excellent $40,576 |
| Immigrants | South Eastern Asia | 85.7 /100 | #139 | Excellent $40,558 |
| Serbians | 85.2 /100 | #140 | Excellent $40,539 |
| Immigrants | Syria | 84.1 /100 | #141 | Excellent $40,499 |
| Sri Lankans | 84.0 /100 | #142 | Excellent $40,496 |