Albanian vs Immigrants from Kazakhstan Median Female Earnings
COMPARE
Albanian
Immigrants from Kazakhstan
Median Female Earnings
Median Female Earnings Comparison
Albanians
Immigrants from Kazakhstan
$42,584
MEDIAN FEMALE EARNINGS
99.8/ 100
METRIC RATING
72nd/ 347
METRIC RANK
$42,386
MEDIAN FEMALE EARNINGS
99.6/ 100
METRIC RATING
78th/ 347
METRIC RANK
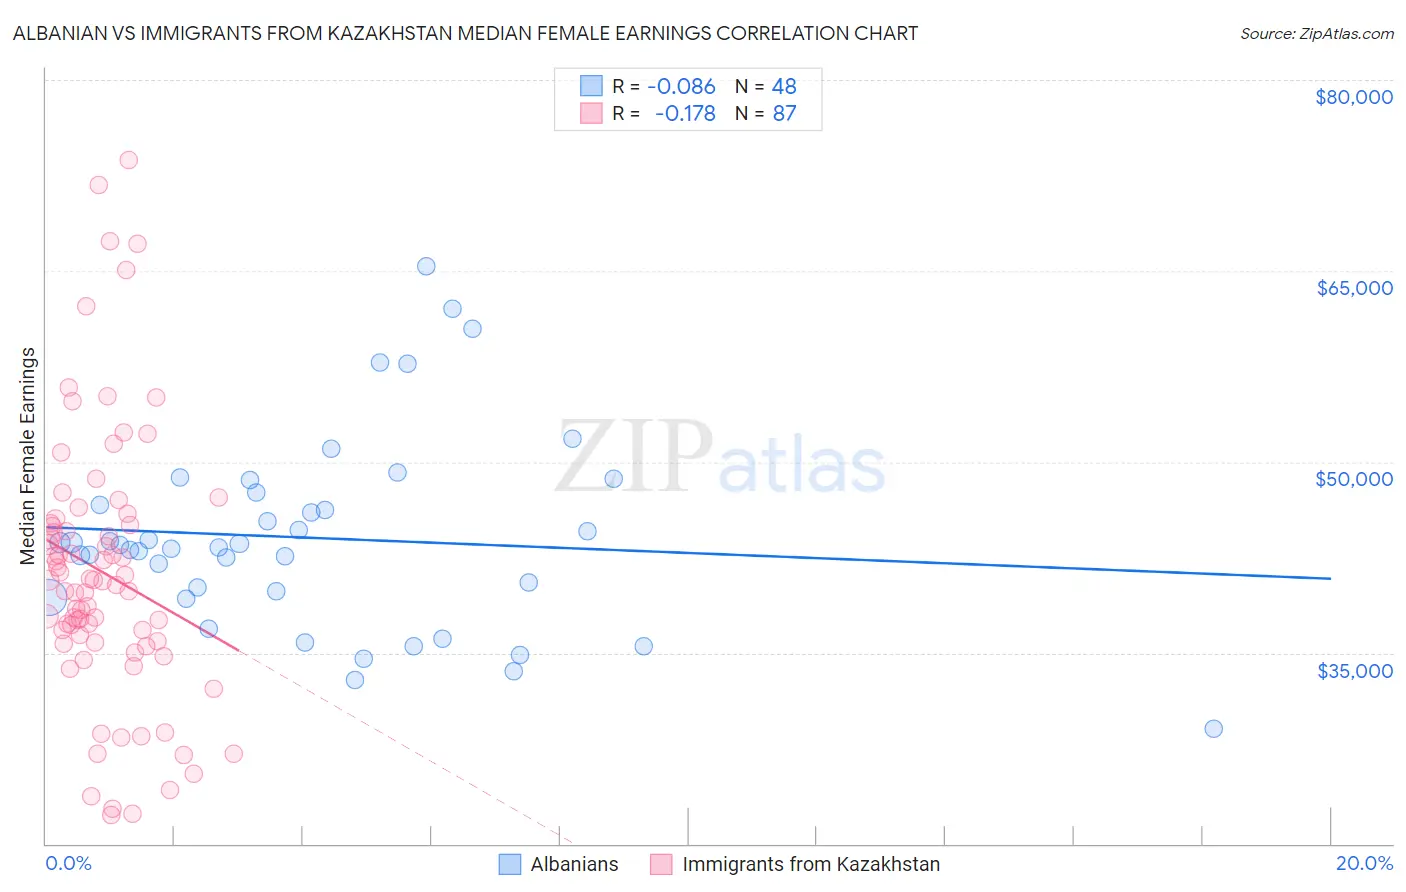
Albanian vs Immigrants from Kazakhstan Median Female Earnings Correlation Chart
The statistical analysis conducted on geographies consisting of 193,224,752 people shows a slight negative correlation between the proportion of Albanians and median female earnings in the United States with a correlation coefficient (R) of -0.086 and weighted average of $42,584. Similarly, the statistical analysis conducted on geographies consisting of 124,420,092 people shows a poor negative correlation between the proportion of Immigrants from Kazakhstan and median female earnings in the United States with a correlation coefficient (R) of -0.178 and weighted average of $42,386, a difference of 0.47%.
Median Female Earnings Correlation Summary
| Measurement | Albanian | Immigrants from Kazakhstan |
| Minimum | $29,043 | $22,250 |
| Maximum | $65,406 | $73,684 |
| Range | $36,363 | $51,434 |
| Mean | $44,026 | $41,300 |
| Median | $43,361 | $40,614 |
| Interquartile 25% (IQ1) | $39,614 | $35,762 |
| Interquartile 75% (IQ3) | $47,094 | $45,166 |
| Interquartile Range (IQR) | $7,480 | $9,404 |
| Standard Deviation (Sample) | $7,618 | $10,623 |
| Standard Deviation (Population) | $7,538 | $10,562 |
Demographics Similar to Albanians and Immigrants from Kazakhstan by Median Female Earnings
In terms of median female earnings, the demographic groups most similar to Albanians are Mongolian ($42,542, a difference of 0.10%), Immigrants from South Africa ($42,508, a difference of 0.18%), Immigrants from Romania ($42,718, a difference of 0.32%), New Zealander ($42,446, a difference of 0.32%), and Immigrants from Italy ($42,446, a difference of 0.33%). Similarly, the demographic groups most similar to Immigrants from Kazakhstan are Immigrants from Albania ($42,388, a difference of 0.0%), Greek ($42,336, a difference of 0.12%), New Zealander ($42,446, a difference of 0.14%), Immigrants from Italy ($42,446, a difference of 0.14%), and Immigrants from Moldova ($42,304, a difference of 0.19%).
| Demographics | Rating | Rank | Median Female Earnings |
| Sierra Leoneans | 99.9 /100 | #65 | Exceptional $42,868 |
| Immigrants | Norway | 99.9 /100 | #66 | Exceptional $42,837 |
| Immigrants | Egypt | 99.9 /100 | #67 | Exceptional $42,837 |
| Immigrants | Austria | 99.8 /100 | #68 | Exceptional $42,824 |
| Immigrants | Spain | 99.8 /100 | #69 | Exceptional $42,815 |
| Immigrants | Ethiopia | 99.8 /100 | #70 | Exceptional $42,744 |
| Immigrants | Romania | 99.8 /100 | #71 | Exceptional $42,718 |
| Albanians | 99.8 /100 | #72 | Exceptional $42,584 |
| Mongolians | 99.7 /100 | #73 | Exceptional $42,542 |
| Immigrants | South Africa | 99.7 /100 | #74 | Exceptional $42,508 |
| New Zealanders | 99.7 /100 | #75 | Exceptional $42,446 |
| Immigrants | Italy | 99.7 /100 | #76 | Exceptional $42,446 |
| Immigrants | Albania | 99.6 /100 | #77 | Exceptional $42,388 |
| Immigrants | Kazakhstan | 99.6 /100 | #78 | Exceptional $42,386 |
| Greeks | 99.6 /100 | #79 | Exceptional $42,336 |
| Immigrants | Moldova | 99.6 /100 | #80 | Exceptional $42,304 |
| Immigrants | Southern Europe | 99.5 /100 | #81 | Exceptional $42,275 |
| Immigrants | Morocco | 99.5 /100 | #82 | Exceptional $42,229 |
| Immigrants | Sierra Leone | 99.5 /100 | #83 | Exceptional $42,214 |
| Armenians | 99.5 /100 | #84 | Exceptional $42,212 |
| Laotians | 99.4 /100 | #85 | Exceptional $42,133 |