Albanian vs Immigrants from El Salvador Median Female Earnings
COMPARE
Albanian
Immigrants from El Salvador
Median Female Earnings
Median Female Earnings Comparison
Albanians
Immigrants from El Salvador
$42,584
MEDIAN FEMALE EARNINGS
99.8/ 100
METRIC RATING
72nd/ 347
METRIC RANK
$36,673
MEDIAN FEMALE EARNINGS
0.2/ 100
METRIC RATING
274th/ 347
METRIC RANK
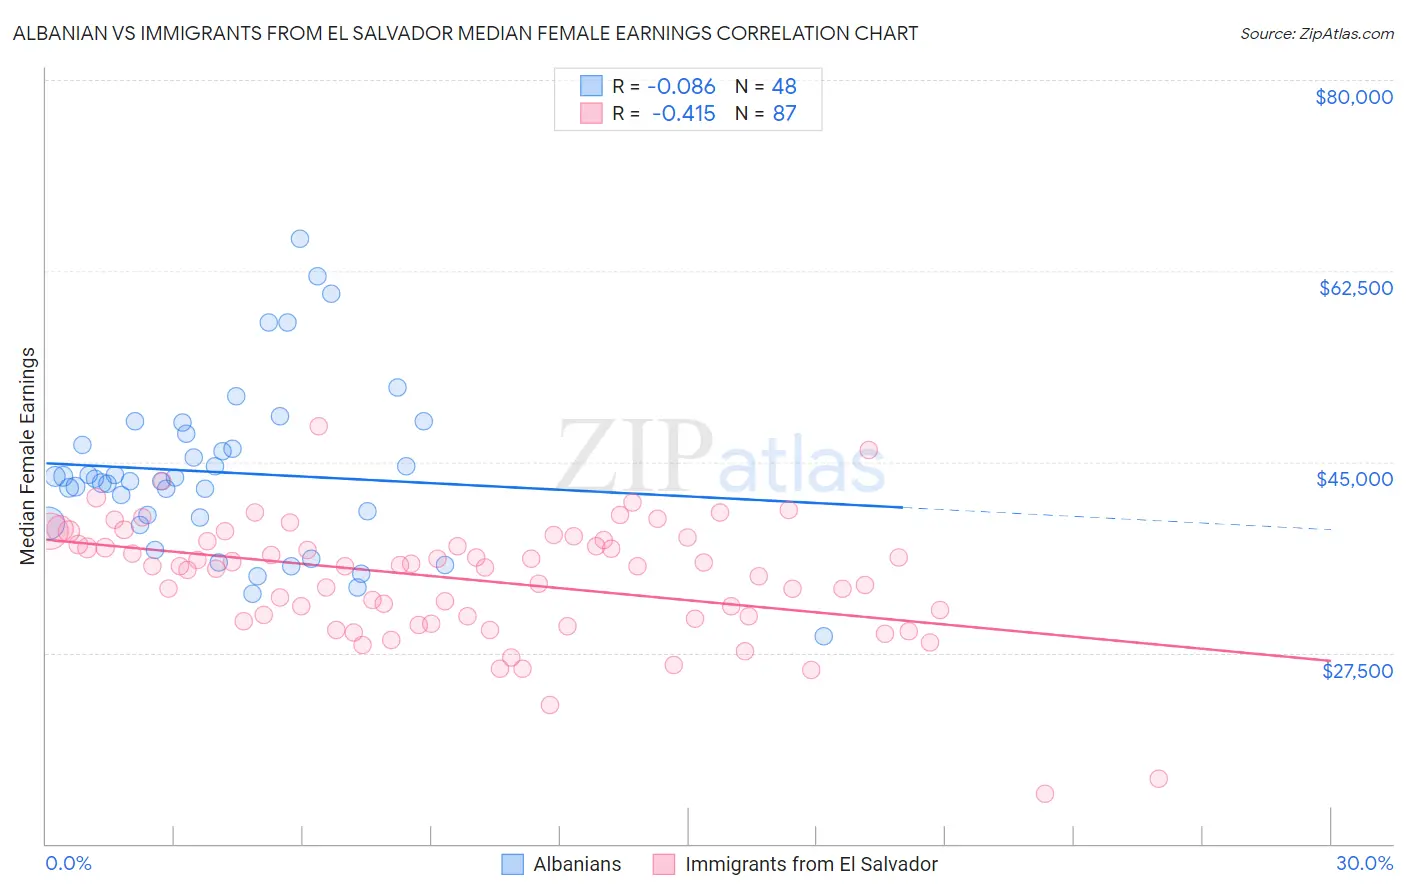
Albanian vs Immigrants from El Salvador Median Female Earnings Correlation Chart
The statistical analysis conducted on geographies consisting of 193,224,752 people shows a slight negative correlation between the proportion of Albanians and median female earnings in the United States with a correlation coefficient (R) of -0.086 and weighted average of $42,584. Similarly, the statistical analysis conducted on geographies consisting of 357,700,398 people shows a moderate negative correlation between the proportion of Immigrants from El Salvador and median female earnings in the United States with a correlation coefficient (R) of -0.415 and weighted average of $36,673, a difference of 16.1%.
Median Female Earnings Correlation Summary
| Measurement | Albanian | Immigrants from El Salvador |
| Minimum | $29,043 | $14,546 |
| Maximum | $65,406 | $48,246 |
| Range | $36,363 | $33,701 |
| Mean | $44,026 | $34,218 |
| Median | $43,361 | $35,415 |
| Interquartile 25% (IQ1) | $39,614 | $30,625 |
| Interquartile 75% (IQ3) | $47,094 | $37,872 |
| Interquartile Range (IQR) | $7,480 | $7,247 |
| Standard Deviation (Sample) | $7,618 | $5,551 |
| Standard Deviation (Population) | $7,538 | $5,519 |
Similar Demographics by Median Female Earnings
Demographics Similar to Albanians by Median Female Earnings
In terms of median female earnings, the demographic groups most similar to Albanians are Mongolian ($42,542, a difference of 0.10%), Immigrants from South Africa ($42,508, a difference of 0.18%), Immigrants from Romania ($42,718, a difference of 0.32%), New Zealander ($42,446, a difference of 0.32%), and Immigrants from Italy ($42,446, a difference of 0.33%).
| Demographics | Rating | Rank | Median Female Earnings |
| Sierra Leoneans | 99.9 /100 | #65 | Exceptional $42,868 |
| Immigrants | Norway | 99.9 /100 | #66 | Exceptional $42,837 |
| Immigrants | Egypt | 99.9 /100 | #67 | Exceptional $42,837 |
| Immigrants | Austria | 99.8 /100 | #68 | Exceptional $42,824 |
| Immigrants | Spain | 99.8 /100 | #69 | Exceptional $42,815 |
| Immigrants | Ethiopia | 99.8 /100 | #70 | Exceptional $42,744 |
| Immigrants | Romania | 99.8 /100 | #71 | Exceptional $42,718 |
| Albanians | 99.8 /100 | #72 | Exceptional $42,584 |
| Mongolians | 99.7 /100 | #73 | Exceptional $42,542 |
| Immigrants | South Africa | 99.7 /100 | #74 | Exceptional $42,508 |
| New Zealanders | 99.7 /100 | #75 | Exceptional $42,446 |
| Immigrants | Italy | 99.7 /100 | #76 | Exceptional $42,446 |
| Immigrants | Albania | 99.6 /100 | #77 | Exceptional $42,388 |
| Immigrants | Kazakhstan | 99.6 /100 | #78 | Exceptional $42,386 |
| Greeks | 99.6 /100 | #79 | Exceptional $42,336 |
Demographics Similar to Immigrants from El Salvador by Median Female Earnings
In terms of median female earnings, the demographic groups most similar to Immigrants from El Salvador are African ($36,530, a difference of 0.39%), Immigrants from Laos ($36,841, a difference of 0.46%), Central American ($36,492, a difference of 0.49%), Immigrants from Dominican Republic ($36,857, a difference of 0.50%), and Marshallese ($36,459, a difference of 0.59%).
| Demographics | Rating | Rank | Median Female Earnings |
| Immigrants | Nonimmigrants | 0.4 /100 | #267 | Tragic $37,024 |
| Cree | 0.4 /100 | #268 | Tragic $37,018 |
| Immigrants | Venezuela | 0.4 /100 | #269 | Tragic $37,003 |
| French American Indians | 0.3 /100 | #270 | Tragic $36,920 |
| Nicaraguans | 0.3 /100 | #271 | Tragic $36,904 |
| Immigrants | Dominican Republic | 0.3 /100 | #272 | Tragic $36,857 |
| Immigrants | Laos | 0.3 /100 | #273 | Tragic $36,841 |
| Immigrants | El Salvador | 0.2 /100 | #274 | Tragic $36,673 |
| Africans | 0.1 /100 | #275 | Tragic $36,530 |
| Central Americans | 0.1 /100 | #276 | Tragic $36,492 |
| Marshallese | 0.1 /100 | #277 | Tragic $36,459 |
| U.S. Virgin Islanders | 0.1 /100 | #278 | Tragic $36,424 |
| Immigrants | Caribbean | 0.1 /100 | #279 | Tragic $36,414 |
| Iroquois | 0.1 /100 | #280 | Tragic $36,408 |
| Spanish Americans | 0.1 /100 | #281 | Tragic $36,391 |