Albanian vs Immigrants from Haiti Median Female Earnings
COMPARE
Albanian
Immigrants from Haiti
Median Female Earnings
Median Female Earnings Comparison
Albanians
Immigrants from Haiti
$42,584
MEDIAN FEMALE EARNINGS
99.8/ 100
METRIC RATING
72nd/ 347
METRIC RANK
$36,203
MEDIAN FEMALE EARNINGS
0.1/ 100
METRIC RATING
283rd/ 347
METRIC RANK
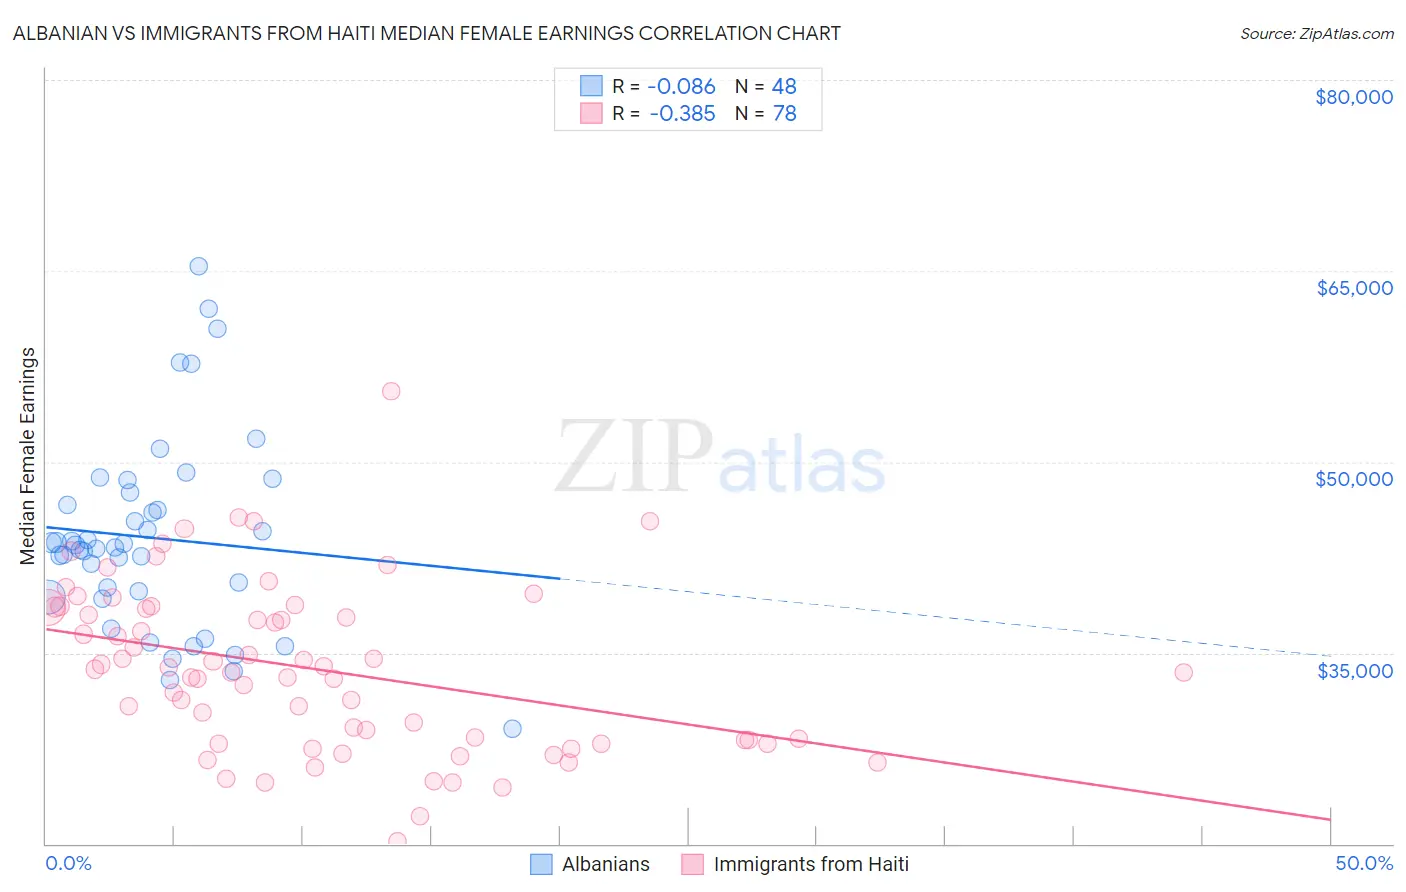
Albanian vs Immigrants from Haiti Median Female Earnings Correlation Chart
The statistical analysis conducted on geographies consisting of 193,224,752 people shows a slight negative correlation between the proportion of Albanians and median female earnings in the United States with a correlation coefficient (R) of -0.086 and weighted average of $42,584. Similarly, the statistical analysis conducted on geographies consisting of 225,248,114 people shows a mild negative correlation between the proportion of Immigrants from Haiti and median female earnings in the United States with a correlation coefficient (R) of -0.385 and weighted average of $36,203, a difference of 17.6%.
Median Female Earnings Correlation Summary
| Measurement | Albanian | Immigrants from Haiti |
| Minimum | $29,043 | $20,229 |
| Maximum | $65,406 | $55,536 |
| Range | $36,363 | $35,307 |
| Mean | $44,026 | $33,736 |
| Median | $43,361 | $33,585 |
| Interquartile 25% (IQ1) | $39,614 | $28,139 |
| Interquartile 75% (IQ3) | $47,094 | $38,581 |
| Interquartile Range (IQR) | $7,480 | $10,442 |
| Standard Deviation (Sample) | $7,618 | $6,572 |
| Standard Deviation (Population) | $7,538 | $6,529 |
Similar Demographics by Median Female Earnings
Demographics Similar to Albanians by Median Female Earnings
In terms of median female earnings, the demographic groups most similar to Albanians are Mongolian ($42,542, a difference of 0.10%), Immigrants from South Africa ($42,508, a difference of 0.18%), Immigrants from Romania ($42,718, a difference of 0.32%), New Zealander ($42,446, a difference of 0.32%), and Immigrants from Italy ($42,446, a difference of 0.33%).
| Demographics | Rating | Rank | Median Female Earnings |
| Sierra Leoneans | 99.9 /100 | #65 | Exceptional $42,868 |
| Immigrants | Norway | 99.9 /100 | #66 | Exceptional $42,837 |
| Immigrants | Egypt | 99.9 /100 | #67 | Exceptional $42,837 |
| Immigrants | Austria | 99.8 /100 | #68 | Exceptional $42,824 |
| Immigrants | Spain | 99.8 /100 | #69 | Exceptional $42,815 |
| Immigrants | Ethiopia | 99.8 /100 | #70 | Exceptional $42,744 |
| Immigrants | Romania | 99.8 /100 | #71 | Exceptional $42,718 |
| Albanians | 99.8 /100 | #72 | Exceptional $42,584 |
| Mongolians | 99.7 /100 | #73 | Exceptional $42,542 |
| Immigrants | South Africa | 99.7 /100 | #74 | Exceptional $42,508 |
| New Zealanders | 99.7 /100 | #75 | Exceptional $42,446 |
| Immigrants | Italy | 99.7 /100 | #76 | Exceptional $42,446 |
| Immigrants | Albania | 99.6 /100 | #77 | Exceptional $42,388 |
| Immigrants | Kazakhstan | 99.6 /100 | #78 | Exceptional $42,386 |
| Greeks | 99.6 /100 | #79 | Exceptional $42,336 |
Demographics Similar to Immigrants from Haiti by Median Female Earnings
In terms of median female earnings, the demographic groups most similar to Immigrants from Haiti are Indonesian ($36,140, a difference of 0.17%), Paiute ($36,056, a difference of 0.41%), Haitian ($36,374, a difference of 0.47%), Osage ($36,034, a difference of 0.47%), and Immigrants from Nicaragua ($36,023, a difference of 0.50%).
| Demographics | Rating | Rank | Median Female Earnings |
| Central Americans | 0.1 /100 | #276 | Tragic $36,492 |
| Marshallese | 0.1 /100 | #277 | Tragic $36,459 |
| U.S. Virgin Islanders | 0.1 /100 | #278 | Tragic $36,424 |
| Immigrants | Caribbean | 0.1 /100 | #279 | Tragic $36,414 |
| Iroquois | 0.1 /100 | #280 | Tragic $36,408 |
| Spanish Americans | 0.1 /100 | #281 | Tragic $36,391 |
| Haitians | 0.1 /100 | #282 | Tragic $36,374 |
| Immigrants | Haiti | 0.1 /100 | #283 | Tragic $36,203 |
| Indonesians | 0.1 /100 | #284 | Tragic $36,140 |
| Paiute | 0.1 /100 | #285 | Tragic $36,056 |
| Osage | 0.0 /100 | #286 | Tragic $36,034 |
| Immigrants | Nicaragua | 0.0 /100 | #287 | Tragic $36,023 |
| Immigrants | Zaire | 0.0 /100 | #288 | Tragic $36,017 |
| Bangladeshis | 0.0 /100 | #289 | Tragic $35,960 |
| Central American Indians | 0.0 /100 | #290 | Tragic $35,930 |