Albanian vs Immigrants from Western Europe Median Female Earnings

COMPARE

Albanian
Race
Ancestry
AfghanAfricanAlaska NativeAlaskan AthabascanAlbanianAleutAlsatianAmericanApacheArabArapahoArgentineanArmenianAssyrian/Chaldean/SyriacAustralianAustrianBahamianBangladeshiBarbadianBasqueBelgianBelizeanBermudanBhutaneseBlackfeetBolivianBrazilianBritishBritish West IndianBulgarianBurmeseCajunCambodianCanadianCape VerdeanCarpatho RusynCelticCentral AmericanCentral American IndianCherokeeCheyenneChickasawChileanChineseChippewaChoctawColombianColvilleComancheCosta RicanCreeCreekCroatianCrowCubanCypriotCzechCzechoslovakianDanishDelawareDominicanDutchDutch West IndianEastern EuropeanEcuadorianEgyptianEnglishEstonianEthiopianEuropeanFijianFilipinoFinnishFrenchFrench American IndianFrench CanadianGermanGerman RussianGhanaianGreekGuamanian/ChamorroGuatemalanGuyaneseHaitianHmongHonduranHopiHoumaHungarianIcelanderIndian (Asian)IndonesianInupiatIranianIraqiIrishIroquoisIsraeliItalianJamaicanJapaneseJordanianKenyanKiowaKoreanLaotianLatvianLebaneseLiberianLithuanianLumbeeLuxembourgerMacedonianMalaysianMalteseMarshalleseMenomineeMexicanMexican American IndianMongolianMoroccanNative HawaiianNavajoNepaleseNew ZealanderNicaraguanNigerianNorthern EuropeanNorwegianOkinawanOsageOttawaPaiutePakistaniPalestinianPanamanianParaguayanPennsylvania GermanPeruvianPimaPolishPortuguesePotawatomiPuebloPuerto RicanPuget Sound SalishRomanianRussianSalvadoranSamoanScandinavianScotch-IrishScottishSeminoleSenegaleseSerbianShoshoneSierra LeoneanSiouxSlavicSlovakSloveneSomaliSouth AfricanSouth AmericanSouth American IndianSoviet UnionSpaniardSpanishSpanish AmericanSpanish American IndianSri LankanSubsaharan AfricanSudaneseSwedishSwissSyrianTaiwaneseThaiTlingit-HaidaTohono O'OdhamTonganTrinidadian and TobagonianTsimshianTurkishU.S. Virgin IslanderUgandanUkrainianUruguayanUteVenezuelanVietnameseWelshWest IndianYakamaYaquiYugoslavianYumanYup'ikZimbabwean
Immigration
NonimmigrantsImmigrantsAfghanistanAfricaAlbaniaArgentinaArmeniaAsiaAustraliaAustriaBahamasBangladeshBarbadosBelarusBelgiumBelizeBoliviaBosnia and HerzegovinaBrazilBulgariaBurma/MyanmarCabo VerdeCambodiaCameroonCanadaCaribbeanCentral AmericaChileChinaColombiaCongoCosta RicaCroatiaCubaCzechoslovakiaDenmarkDominicaDominican RepublicEastern AfricaEastern AsiaEastern EuropeEcuadorEgyptEl SalvadorEnglandEritreaEthiopiaEuropeFijiFranceGermanyGhanaGreeceGrenadaGuatemalaGuyanaHaitiHondurasHong KongHungaryIndiaIndonesiaIranIraqIrelandIsraelItalyJamaicaJapanJordanKazakhstanKenyaKoreaKuwaitLaosLatin AmericaLatviaLebanonLiberiaLithuaniaMalaysiaMexicoMicronesiaMiddle AfricaMoldovaMoroccoNepalNetherlandsNicaraguaNigeriaNorth AmericaNorth MacedoniaNorthern AfricaNorthern EuropeNorwayOceaniaPakistanPanamaPeruPhilippinesPolandPortugalRomaniaRussiaSaudi ArabiaScotlandSenegalSerbiaSierra LeoneSingaporeSomaliaSouth AfricaSouth AmericaSouth Central AsiaSouth Eastern AsiaSouthern EuropeSpainSri LankaSt. Vincent and the GrenadinesSudanSwedenSwitzerlandSyriaTaiwanThailandTrinidad and TobagoTurkeyUgandaUkraineUruguayUzbekistanVenezuelaVietnamWest IndiesWestern AfricaWestern AsiaYemenZaireZimbabweAzores
Immigrants from Western Europe
Race
Ancestry
AfghanAfricanAlaska NativeAlaskan AthabascanAleutAlsatianAmericanApacheArabArapahoArgentineanArmenianAssyrian/Chaldean/SyriacAustralianAustrianBahamianBangladeshiBarbadianBasqueBelgianBelizeanBermudanBhutaneseBlackfeetBolivianBrazilianBritishBritish West IndianBulgarianBurmeseCajunCambodianCanadianCape VerdeanCarpatho RusynCelticCentral AmericanCentral American IndianCherokeeCheyenneChickasawChileanChineseChippewaChoctawColombianColvilleComancheCosta RicanCreeCreekCroatianCrowCubanCypriotCzechCzechoslovakianDanishDelawareDominicanDutchDutch West IndianEastern EuropeanEcuadorianEgyptianEnglishEstonianEthiopianEuropeanFijianFilipinoFinnishFrenchFrench American IndianFrench CanadianGermanGerman RussianGhanaianGreekGuamanian/ChamorroGuatemalanGuyaneseHaitianHmongHonduranHopiHoumaHungarianIcelanderIndian (Asian)IndonesianInupiatIranianIraqiIrishIroquoisIsraeliItalianJamaicanJapaneseJordanianKenyanKiowaKoreanLaotianLatvianLebaneseLiberianLithuanianLumbeeLuxembourgerMacedonianMalaysianMalteseMarshalleseMenomineeMexicanMexican American IndianMongolianMoroccanNative HawaiianNavajoNepaleseNew ZealanderNicaraguanNigerianNorthern EuropeanNorwegianOkinawanOsageOttawaPaiutePakistaniPalestinianPanamanianParaguayanPennsylvania GermanPeruvianPimaPolishPortuguesePotawatomiPuebloPuerto RicanPuget Sound SalishRomanianRussianSalvadoranSamoanScandinavianScotch-IrishScottishSeminoleSenegaleseSerbianShoshoneSierra LeoneanSiouxSlavicSlovakSloveneSomaliSouth AfricanSouth AmericanSouth American IndianSoviet UnionSpaniardSpanishSpanish AmericanSpanish American IndianSri LankanSubsaharan AfricanSudaneseSwedishSwissSyrianTaiwaneseThaiTlingit-HaidaTohono O'OdhamTonganTrinidadian and TobagonianTsimshianTurkishU.S. Virgin IslanderUgandanUkrainianUruguayanUteVenezuelanVietnameseWelshWest IndianYakamaYaquiYugoslavianYumanYup'ikZimbabwean
Immigration
NonimmigrantsImmigrantsAfghanistanAfricaAlbaniaArgentinaArmeniaAsiaAustraliaAustriaBahamasBangladeshBarbadosBelarusBelgiumBelizeBoliviaBosnia and HerzegovinaBrazilBulgariaBurma/MyanmarCabo VerdeCambodiaCameroonCanadaCaribbeanCentral AmericaChileChinaColombiaCongoCosta RicaCroatiaCubaCzechoslovakiaDenmarkDominicaDominican RepublicEastern AfricaEastern AsiaEastern EuropeEcuadorEgyptEl SalvadorEnglandEritreaEthiopiaEuropeFijiFranceGermanyGhanaGreeceGrenadaGuatemalaGuyanaHaitiHondurasHong KongHungaryIndiaIndonesiaIranIraqIrelandIsraelItalyJamaicaJapanJordanKazakhstanKenyaKoreaKuwaitLaosLatin AmericaLatviaLebanonLiberiaLithuaniaMalaysiaMexicoMicronesiaMiddle AfricaMoldovaMoroccoNepalNetherlandsNicaraguaNigeriaNorth AmericaNorth MacedoniaNorthern AfricaNorthern EuropeNorwayOceaniaPakistanPanamaPeruPhilippinesPolandPortugalRomaniaRussiaSaudi ArabiaScotlandSenegalSerbiaSierra LeoneSingaporeSomaliaSouth AfricaSouth AmericaSouth Central AsiaSouth Eastern AsiaSouthern EuropeSpainSri LankaSt. Vincent and the GrenadinesSudanSwedenSwitzerlandSyriaTaiwanThailandTrinidad and TobagoTurkeyUgandaUkraineUruguayUzbekistanVenezuelaVietnamWest IndiesWestern AfricaWestern AsiaWestern EuropeYemenZaireZimbabweAzores
Median Female Earnings
Income
Poverty
Unemployment
Labor Participation
Family Structure
Vehicle Availability
Education Level
Disability

Median Female Earnings Comparison

Albanians

Immigrants from Western Europe

Exceptional
Exceptional
$42,584
MEDIAN FEMALE EARNINGS
99.8/ 100
METRIC RATING
72nd/ 347
METRIC RANK
$41,990
MEDIAN FEMALE EARNINGS
99.2/ 100
METRIC RATING
91st/ 347
METRIC RANK

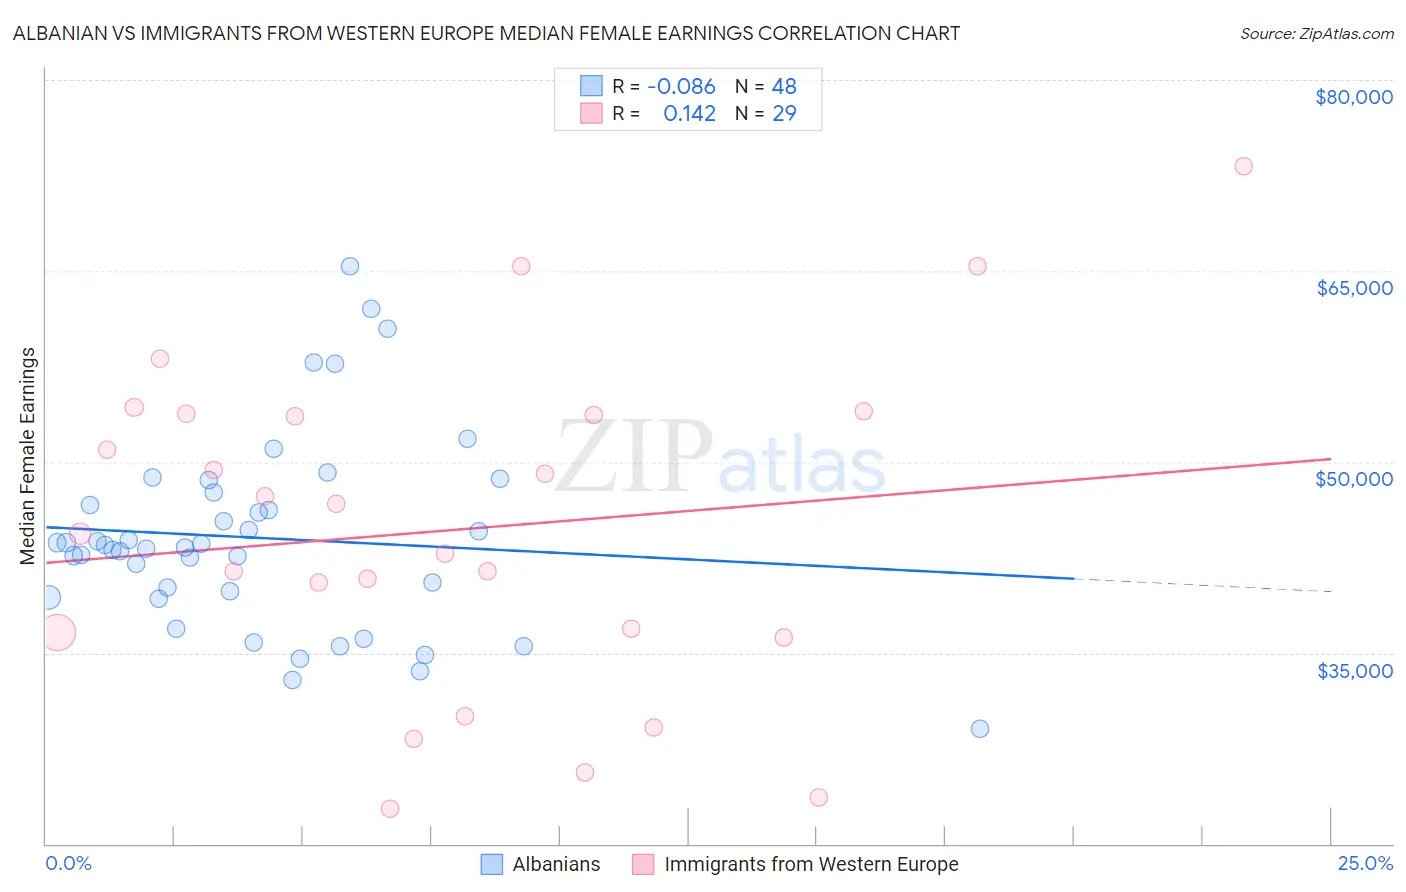
Albanian vs Immigrants from Western Europe Median Female Earnings Correlation Chart

The statistical analysis conducted on geographies consisting of 193,224,752 people shows a slight negative correlation between the proportion of Albanians and median female earnings in the United States with a correlation coefficient (R) of -0.086 and weighted average of $42,584. Similarly, the statistical analysis conducted on geographies consisting of 493,549,383 people shows a poor positive correlation between the proportion of Immigrants from Western Europe and median female earnings in the United States with a correlation coefficient (R) of 0.142 and weighted average of $41,990, a difference of 1.4%.
Albanian vs Immigrants from Western Europe Median Female Earnings

Median Female Earnings Correlation Summary

MeasurementAlbanianImmigrants from Western Europe
Minimum$29,043$22,777
Maximum$65,406$73,250
Range$36,363$50,473
Mean$44,026$44,663
Median$43,361$44,308
Interquartile 25% (IQ1)$39,614$36,403
Interquartile 75% (IQ3)$47,094$53,740
Interquartile Range (IQR)$7,480$17,337
Standard Deviation (Sample)$7,618$12,864
Standard Deviation (Population)$7,538$12,640

Demographics Similar to Albanians and Immigrants from Western Europe by Median Female Earnings

In terms of median female earnings, the demographic groups most similar to Albanians are Mongolian ($42,542, a difference of 0.10%), Immigrants from South Africa ($42,508, a difference of 0.18%), Immigrants from Romania ($42,718, a difference of 0.32%), New Zealander ($42,446, a difference of 0.32%), and Immigrants from Italy ($42,446, a difference of 0.33%). Similarly, the demographic groups most similar to Immigrants from Western Europe are Ukrainian ($42,015, a difference of 0.060%), Immigrants from Afghanistan ($42,055, a difference of 0.15%), Immigrants from Northern Africa ($42,084, a difference of 0.22%), Immigrants from St. Vincent and the Grenadines ($42,108, a difference of 0.28%), and Lithuanian ($42,108, a difference of 0.28%).
DemographicsRating | RankMedian Female Earnings
Immigrants | Romania
99.8
/100
|
#71
Exceptional
$42,718
Albanians
99.8
/100
|
#72
Exceptional
$42,584
Mongolians
99.7
/100
|
#73
Exceptional
$42,542
Immigrants | South Africa
99.7
/100
|
#74
Exceptional
$42,508
New Zealanders
99.7
/100
|
#75
Exceptional
$42,446
Immigrants | Italy
99.7
/100
|
#76
Exceptional
$42,446
Immigrants | Albania
99.6
/100
|
#77
Exceptional
$42,388
Immigrants | Kazakhstan
99.6
/100
|
#78
Exceptional
$42,386
Greeks
99.6
/100
|
#79
Exceptional
$42,336
Immigrants | Moldova
99.6
/100
|
#80
Exceptional
$42,304
Immigrants | Southern Europe
99.5
/100
|
#81
Exceptional
$42,275
Immigrants | Morocco
99.5
/100
|
#82
Exceptional
$42,229
Immigrants | Sierra Leone
99.5
/100
|
#83
Exceptional
$42,214
Armenians
99.5
/100
|
#84
Exceptional
$42,212
Laotians
99.4
/100
|
#85
Exceptional
$42,133
Immigrants | St. Vincent and the Grenadines
99.3
/100
|
#86
Exceptional
$42,108
Lithuanians
99.3
/100
|
#87
Exceptional
$42,108
Immigrants | Northern Africa
99.3
/100
|
#88
Exceptional
$42,084
Immigrants | Afghanistan
99.3
/100
|
#89
Exceptional
$42,055
Ukrainians
99.2
/100
|
#90
Exceptional
$42,015
Immigrants | Western Europe
99.2
/100
|
#91
Exceptional
$41,990