Seminole vs Immigrants from Serbia Median Female Earnings
COMPARE
Seminole
Immigrants from Serbia
Median Female Earnings
Median Female Earnings Comparison
Seminole
Immigrants from Serbia
$34,385
MEDIAN FEMALE EARNINGS
0.0/ 100
METRIC RATING
323rd/ 347
METRIC RANK
$43,385
MEDIAN FEMALE EARNINGS
100.0/ 100
METRIC RATING
49th/ 347
METRIC RANK
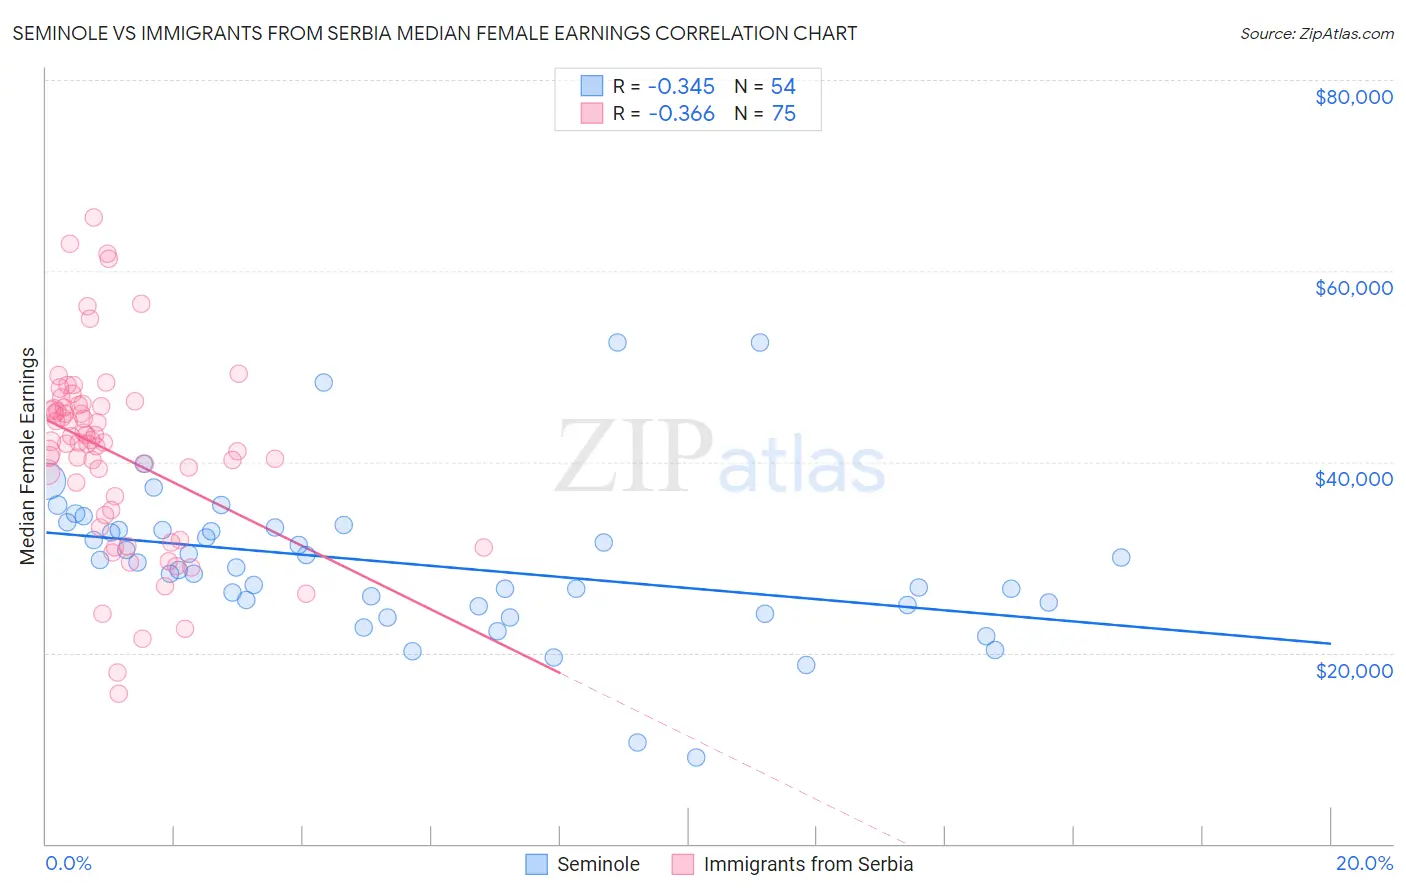
Seminole vs Immigrants from Serbia Median Female Earnings Correlation Chart
The statistical analysis conducted on geographies consisting of 118,266,998 people shows a mild negative correlation between the proportion of Seminole and median female earnings in the United States with a correlation coefficient (R) of -0.345 and weighted average of $34,385. Similarly, the statistical analysis conducted on geographies consisting of 131,728,260 people shows a mild negative correlation between the proportion of Immigrants from Serbia and median female earnings in the United States with a correlation coefficient (R) of -0.366 and weighted average of $43,385, a difference of 26.2%.
Median Female Earnings Correlation Summary
| Measurement | Seminole | Immigrants from Serbia |
| Minimum | $9,041 | $15,750 |
| Maximum | $52,528 | $65,545 |
| Range | $43,487 | $49,795 |
| Mean | $29,347 | $40,928 |
| Median | $29,210 | $42,089 |
| Interquartile 25% (IQ1) | $25,000 | $34,470 |
| Interquartile 75% (IQ3) | $32,861 | $45,867 |
| Interquartile Range (IQR) | $7,861 | $11,397 |
| Standard Deviation (Sample) | $8,052 | $9,877 |
| Standard Deviation (Population) | $7,977 | $9,811 |
Similar Demographics by Median Female Earnings
Demographics Similar to Seminole by Median Female Earnings
In terms of median female earnings, the demographic groups most similar to Seminole are Chickasaw ($34,414, a difference of 0.080%), Hispanic or Latino ($34,421, a difference of 0.11%), Immigrants from Congo ($34,317, a difference of 0.20%), Immigrants from Honduras ($34,647, a difference of 0.76%), and Dutch West Indian ($34,106, a difference of 0.82%).
| Demographics | Rating | Rank | Median Female Earnings |
| Cherokee | 0.0 /100 | #316 | Tragic $34,742 |
| Potawatomi | 0.0 /100 | #317 | Tragic $34,739 |
| Immigrants | Yemen | 0.0 /100 | #318 | Tragic $34,693 |
| Shoshone | 0.0 /100 | #319 | Tragic $34,677 |
| Immigrants | Honduras | 0.0 /100 | #320 | Tragic $34,647 |
| Hispanics or Latinos | 0.0 /100 | #321 | Tragic $34,421 |
| Chickasaw | 0.0 /100 | #322 | Tragic $34,414 |
| Seminole | 0.0 /100 | #323 | Tragic $34,385 |
| Immigrants | Congo | 0.0 /100 | #324 | Tragic $34,317 |
| Dutch West Indians | 0.0 /100 | #325 | Tragic $34,106 |
| Kiowa | 0.0 /100 | #326 | Tragic $34,074 |
| Cajuns | 0.0 /100 | #327 | Tragic $34,034 |
| Immigrants | Central America | 0.0 /100 | #328 | Tragic $33,953 |
| Hopi | 0.0 /100 | #329 | Tragic $33,932 |
| Menominee | 0.0 /100 | #330 | Tragic $33,894 |
Demographics Similar to Immigrants from Serbia by Median Female Earnings
In terms of median female earnings, the demographic groups most similar to Immigrants from Serbia are Immigrants from Uzbekistan ($43,363, a difference of 0.050%), Immigrants from Indonesia ($43,412, a difference of 0.060%), Maltese ($43,357, a difference of 0.060%), Bolivian ($43,445, a difference of 0.14%), and Immigrants from Lithuania ($43,317, a difference of 0.16%).
| Demographics | Rating | Rank | Median Female Earnings |
| Immigrants | Denmark | 100.0 /100 | #42 | Exceptional $43,646 |
| Bulgarians | 100.0 /100 | #43 | Exceptional $43,638 |
| Immigrants | Czechoslovakia | 100.0 /100 | #44 | Exceptional $43,571 |
| Immigrants | Europe | 100.0 /100 | #45 | Exceptional $43,523 |
| Immigrants | Bolivia | 100.0 /100 | #46 | Exceptional $43,467 |
| Bolivians | 100.0 /100 | #47 | Exceptional $43,445 |
| Immigrants | Indonesia | 100.0 /100 | #48 | Exceptional $43,412 |
| Immigrants | Serbia | 100.0 /100 | #49 | Exceptional $43,385 |
| Immigrants | Uzbekistan | 100.0 /100 | #50 | Exceptional $43,363 |
| Maltese | 100.0 /100 | #51 | Exceptional $43,357 |
| Immigrants | Lithuania | 99.9 /100 | #52 | Exceptional $43,317 |
| Immigrants | Eastern Europe | 99.9 /100 | #53 | Exceptional $43,309 |
| Australians | 99.9 /100 | #54 | Exceptional $43,308 |
| Egyptians | 99.9 /100 | #55 | Exceptional $43,305 |
| Immigrants | Croatia | 99.9 /100 | #56 | Exceptional $43,258 |