Albanian vs Turkish Median Female Earnings
COMPARE
Albanian
Turkish
Median Female Earnings
Median Female Earnings Comparison
Albanians
Turks
$42,584
MEDIAN FEMALE EARNINGS
99.8/ 100
METRIC RATING
72nd/ 347
METRIC RANK
$44,695
MEDIAN FEMALE EARNINGS
100.0/ 100
METRIC RATING
27th/ 347
METRIC RANK
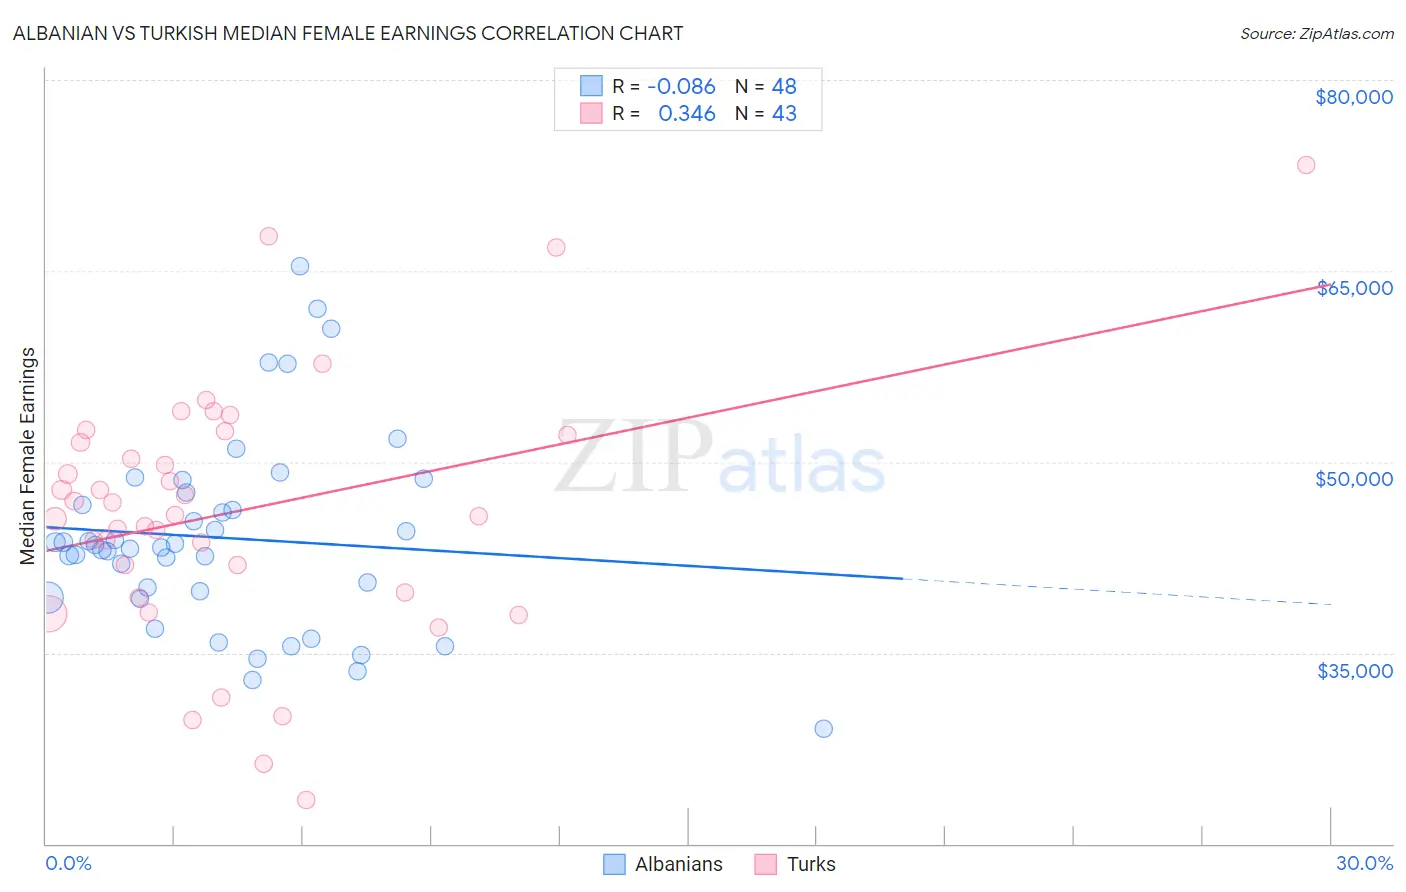
Albanian vs Turkish Median Female Earnings Correlation Chart
The statistical analysis conducted on geographies consisting of 193,224,752 people shows a slight negative correlation between the proportion of Albanians and median female earnings in the United States with a correlation coefficient (R) of -0.086 and weighted average of $42,584. Similarly, the statistical analysis conducted on geographies consisting of 271,816,857 people shows a mild positive correlation between the proportion of Turks and median female earnings in the United States with a correlation coefficient (R) of 0.346 and weighted average of $44,695, a difference of 5.0%.
Median Female Earnings Correlation Summary
| Measurement | Albanian | Turkish |
| Minimum | $29,043 | $23,409 |
| Maximum | $65,406 | $73,333 |
| Range | $36,363 | $49,924 |
| Mean | $44,026 | $46,115 |
| Median | $43,361 | $45,875 |
| Interquartile 25% (IQ1) | $39,614 | $39,746 |
| Interquartile 75% (IQ3) | $47,094 | $52,083 |
| Interquartile Range (IQR) | $7,480 | $12,337 |
| Standard Deviation (Sample) | $7,618 | $10,119 |
| Standard Deviation (Population) | $7,538 | $10,000 |
Similar Demographics by Median Female Earnings
Demographics Similar to Albanians by Median Female Earnings
In terms of median female earnings, the demographic groups most similar to Albanians are Mongolian ($42,542, a difference of 0.10%), Immigrants from South Africa ($42,508, a difference of 0.18%), Immigrants from Romania ($42,718, a difference of 0.32%), New Zealander ($42,446, a difference of 0.32%), and Immigrants from Italy ($42,446, a difference of 0.33%).
| Demographics | Rating | Rank | Median Female Earnings |
| Sierra Leoneans | 99.9 /100 | #65 | Exceptional $42,868 |
| Immigrants | Norway | 99.9 /100 | #66 | Exceptional $42,837 |
| Immigrants | Egypt | 99.9 /100 | #67 | Exceptional $42,837 |
| Immigrants | Austria | 99.8 /100 | #68 | Exceptional $42,824 |
| Immigrants | Spain | 99.8 /100 | #69 | Exceptional $42,815 |
| Immigrants | Ethiopia | 99.8 /100 | #70 | Exceptional $42,744 |
| Immigrants | Romania | 99.8 /100 | #71 | Exceptional $42,718 |
| Albanians | 99.8 /100 | #72 | Exceptional $42,584 |
| Mongolians | 99.7 /100 | #73 | Exceptional $42,542 |
| Immigrants | South Africa | 99.7 /100 | #74 | Exceptional $42,508 |
| New Zealanders | 99.7 /100 | #75 | Exceptional $42,446 |
| Immigrants | Italy | 99.7 /100 | #76 | Exceptional $42,446 |
| Immigrants | Albania | 99.6 /100 | #77 | Exceptional $42,388 |
| Immigrants | Kazakhstan | 99.6 /100 | #78 | Exceptional $42,386 |
| Greeks | 99.6 /100 | #79 | Exceptional $42,336 |
Demographics Similar to Turks by Median Female Earnings
In terms of median female earnings, the demographic groups most similar to Turks are Immigrants from Russia ($44,680, a difference of 0.030%), Immigrants from Belarus ($44,757, a difference of 0.14%), Immigrants from Sweden ($44,774, a difference of 0.18%), Immigrants from Belgium ($44,587, a difference of 0.24%), and Asian ($44,586, a difference of 0.24%).
| Demographics | Rating | Rank | Median Female Earnings |
| Immigrants | Japan | 100.0 /100 | #20 | Exceptional $45,323 |
| Cambodians | 100.0 /100 | #21 | Exceptional $45,014 |
| Immigrants | Greece | 100.0 /100 | #22 | Exceptional $44,976 |
| Burmese | 100.0 /100 | #23 | Exceptional $44,911 |
| Immigrants | Korea | 100.0 /100 | #24 | Exceptional $44,847 |
| Immigrants | Sweden | 100.0 /100 | #25 | Exceptional $44,774 |
| Immigrants | Belarus | 100.0 /100 | #26 | Exceptional $44,757 |
| Turks | 100.0 /100 | #27 | Exceptional $44,695 |
| Immigrants | Russia | 100.0 /100 | #28 | Exceptional $44,680 |
| Immigrants | Belgium | 100.0 /100 | #29 | Exceptional $44,587 |
| Asians | 100.0 /100 | #30 | Exceptional $44,586 |
| Immigrants | France | 100.0 /100 | #31 | Exceptional $44,541 |
| Immigrants | Northern Europe | 100.0 /100 | #32 | Exceptional $44,366 |
| Immigrants | Asia | 100.0 /100 | #33 | Exceptional $44,198 |
| Russians | 100.0 /100 | #34 | Exceptional $44,169 |