Hawaiian vs Immigrants from Serbia Median Female Earnings
COMPARE
Hawaiian
Immigrants from Serbia
Median Female Earnings
Median Female Earnings Comparison
Hawaiians
Immigrants from Serbia
$37,497
MEDIAN FEMALE EARNINGS
1.0/ 100
METRIC RATING
257th/ 347
METRIC RANK
$43,385
MEDIAN FEMALE EARNINGS
100.0/ 100
METRIC RATING
49th/ 347
METRIC RANK
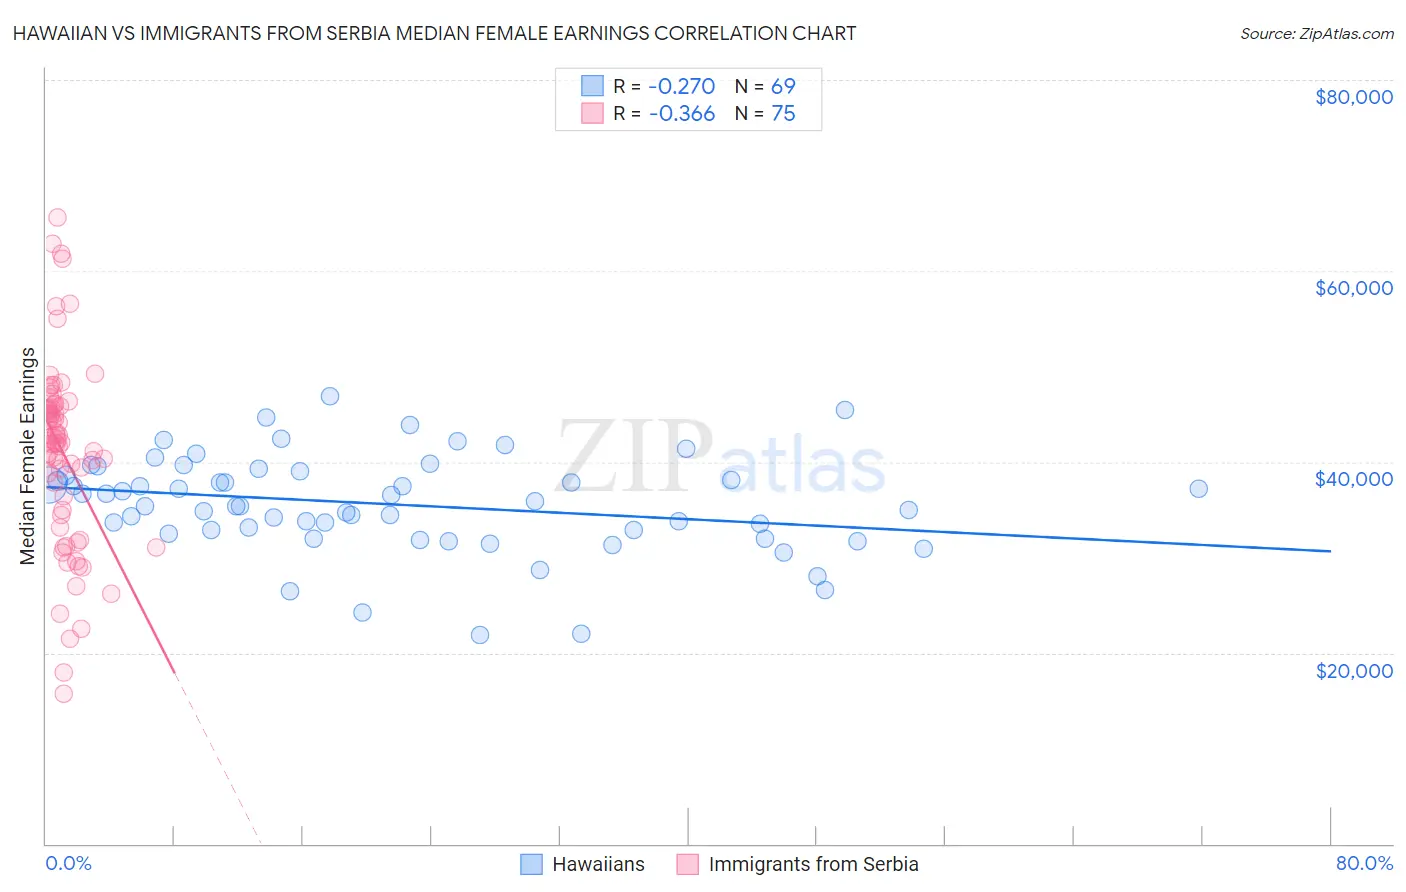
Hawaiian vs Immigrants from Serbia Median Female Earnings Correlation Chart
The statistical analysis conducted on geographies consisting of 327,459,895 people shows a weak negative correlation between the proportion of Hawaiians and median female earnings in the United States with a correlation coefficient (R) of -0.270 and weighted average of $37,497. Similarly, the statistical analysis conducted on geographies consisting of 131,728,260 people shows a mild negative correlation between the proportion of Immigrants from Serbia and median female earnings in the United States with a correlation coefficient (R) of -0.366 and weighted average of $43,385, a difference of 15.7%.
Median Female Earnings Correlation Summary
| Measurement | Hawaiian | Immigrants from Serbia |
| Minimum | $21,870 | $15,750 |
| Maximum | $46,893 | $65,545 |
| Range | $25,022 | $49,795 |
| Mean | $35,548 | $40,928 |
| Median | $35,373 | $42,089 |
| Interquartile 25% (IQ1) | $32,654 | $34,470 |
| Interquartile 75% (IQ3) | $38,788 | $45,867 |
| Interquartile Range (IQR) | $6,134 | $11,397 |
| Standard Deviation (Sample) | $5,103 | $9,877 |
| Standard Deviation (Population) | $5,066 | $9,811 |
Similar Demographics by Median Female Earnings
Demographics Similar to Hawaiians by Median Female Earnings
In terms of median female earnings, the demographic groups most similar to Hawaiians are Samoan ($37,498, a difference of 0.0%), Colville ($37,514, a difference of 0.040%), White/Caucasian ($37,531, a difference of 0.090%), Belizean ($37,429, a difference of 0.18%), and Scotch-Irish ($37,383, a difference of 0.31%).
| Demographics | Rating | Rank | Median Female Earnings |
| Immigrants | Iraq | 2.2 /100 | #250 | Tragic $37,864 |
| Welsh | 2.1 /100 | #251 | Tragic $37,856 |
| Immigrants | Dominica | 2.0 /100 | #252 | Tragic $37,825 |
| Danes | 1.6 /100 | #253 | Tragic $37,730 |
| Whites/Caucasians | 1.1 /100 | #254 | Tragic $37,531 |
| Colville | 1.1 /100 | #255 | Tragic $37,514 |
| Samoans | 1.0 /100 | #256 | Tragic $37,498 |
| Hawaiians | 1.0 /100 | #257 | Tragic $37,497 |
| Belizeans | 0.9 /100 | #258 | Tragic $37,429 |
| Scotch-Irish | 0.8 /100 | #259 | Tragic $37,383 |
| Dutch | 0.7 /100 | #260 | Tragic $37,339 |
| Malaysians | 0.7 /100 | #261 | Tragic $37,298 |
| Venezuelans | 0.7 /100 | #262 | Tragic $37,282 |
| German Russians | 0.5 /100 | #263 | Tragic $37,105 |
| Salvadorans | 0.4 /100 | #264 | Tragic $37,083 |
Demographics Similar to Immigrants from Serbia by Median Female Earnings
In terms of median female earnings, the demographic groups most similar to Immigrants from Serbia are Immigrants from Uzbekistan ($43,363, a difference of 0.050%), Immigrants from Indonesia ($43,412, a difference of 0.060%), Maltese ($43,357, a difference of 0.060%), Bolivian ($43,445, a difference of 0.14%), and Immigrants from Lithuania ($43,317, a difference of 0.16%).
| Demographics | Rating | Rank | Median Female Earnings |
| Immigrants | Denmark | 100.0 /100 | #42 | Exceptional $43,646 |
| Bulgarians | 100.0 /100 | #43 | Exceptional $43,638 |
| Immigrants | Czechoslovakia | 100.0 /100 | #44 | Exceptional $43,571 |
| Immigrants | Europe | 100.0 /100 | #45 | Exceptional $43,523 |
| Immigrants | Bolivia | 100.0 /100 | #46 | Exceptional $43,467 |
| Bolivians | 100.0 /100 | #47 | Exceptional $43,445 |
| Immigrants | Indonesia | 100.0 /100 | #48 | Exceptional $43,412 |
| Immigrants | Serbia | 100.0 /100 | #49 | Exceptional $43,385 |
| Immigrants | Uzbekistan | 100.0 /100 | #50 | Exceptional $43,363 |
| Maltese | 100.0 /100 | #51 | Exceptional $43,357 |
| Immigrants | Lithuania | 99.9 /100 | #52 | Exceptional $43,317 |
| Immigrants | Eastern Europe | 99.9 /100 | #53 | Exceptional $43,309 |
| Australians | 99.9 /100 | #54 | Exceptional $43,308 |
| Egyptians | 99.9 /100 | #55 | Exceptional $43,305 |
| Immigrants | Croatia | 99.9 /100 | #56 | Exceptional $43,258 |