Albanian vs Immigrants from Serbia Hearing Disability
COMPARE
Albanian
Immigrants from Serbia
Hearing Disability
Hearing Disability Comparison
Albanians
Immigrants from Serbia
2.9%
HEARING DISABILITY
66.6/ 100
METRIC RATING
161st/ 347
METRIC RANK
3.0%
HEARING DISABILITY
51.1/ 100
METRIC RATING
173rd/ 347
METRIC RANK
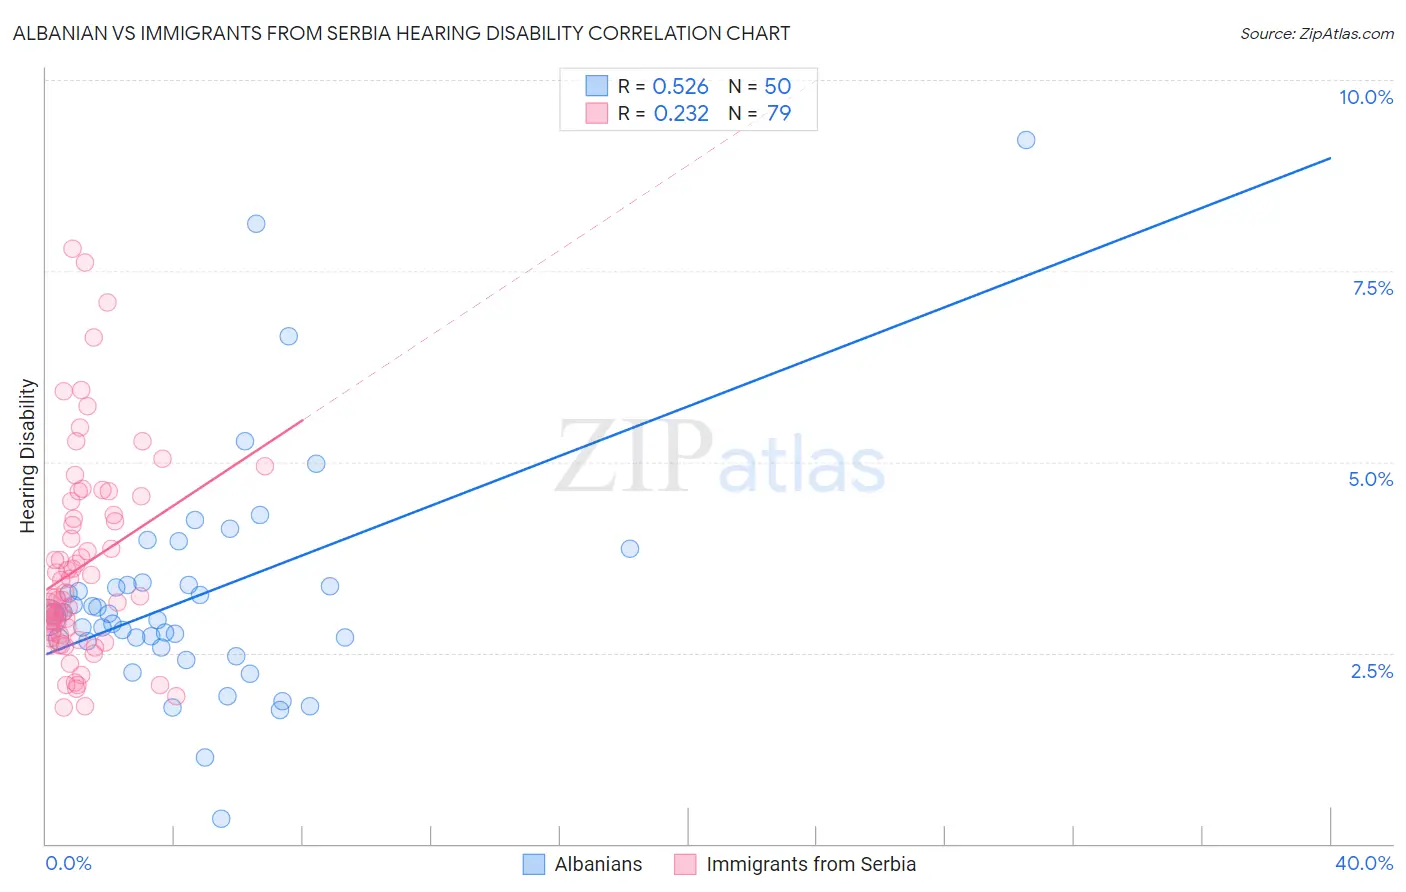
Albanian vs Immigrants from Serbia Hearing Disability Correlation Chart
The statistical analysis conducted on geographies consisting of 193,249,073 people shows a substantial positive correlation between the proportion of Albanians and percentage of population with hearing disability in the United States with a correlation coefficient (R) of 0.526 and weighted average of 2.9%. Similarly, the statistical analysis conducted on geographies consisting of 131,744,668 people shows a weak positive correlation between the proportion of Immigrants from Serbia and percentage of population with hearing disability in the United States with a correlation coefficient (R) of 0.232 and weighted average of 3.0%, a difference of 1.5%.
Hearing Disability Correlation Summary
| Measurement | Albanian | Immigrants from Serbia |
| Minimum | 0.33% | 1.8% |
| Maximum | 9.2% | 7.8% |
| Range | 8.9% | 6.0% |
| Mean | 3.3% | 3.6% |
| Median | 3.0% | 3.2% |
| Interquartile 25% (IQ1) | 2.6% | 2.7% |
| Interquartile 75% (IQ3) | 3.4% | 4.3% |
| Interquartile Range (IQR) | 0.75% | 1.6% |
| Standard Deviation (Sample) | 1.5% | 1.3% |
| Standard Deviation (Population) | 1.5% | 1.3% |
Demographics Similar to Albanians and Immigrants from Serbia by Hearing Disability
In terms of hearing disability, the demographic groups most similar to Albanians are Immigrants from Japan (2.9%, a difference of 0.030%), Immigrants from Fiji (2.9%, a difference of 0.060%), Immigrants from Australia (2.9%, a difference of 0.090%), Immigrants from Central America (3.0%, a difference of 0.17%), and Immigrants from Cambodia (3.0%, a difference of 0.19%). Similarly, the demographic groups most similar to Immigrants from Serbia are Indonesian (3.0%, a difference of 0.10%), Immigrants from Romania (3.0%, a difference of 0.25%), Panamanian (3.0%, a difference of 0.38%), Immigrants from Philippines (3.0%, a difference of 0.44%), and Armenian (3.0%, a difference of 0.47%).
| Demographics | Rating | Rank | Hearing Disability |
| Immigrants | Kazakhstan | 69.6 /100 | #157 | Good 2.9% |
| Immigrants | Burma/Myanmar | 69.5 /100 | #158 | Good 2.9% |
| Immigrants | Australia | 67.4 /100 | #159 | Good 2.9% |
| Immigrants | Fiji | 67.1 /100 | #160 | Good 2.9% |
| Albanians | 66.6 /100 | #161 | Good 2.9% |
| Immigrants | Japan | 66.3 /100 | #162 | Good 2.9% |
| Immigrants | Central America | 64.9 /100 | #163 | Good 3.0% |
| Immigrants | Cambodia | 64.8 /100 | #164 | Good 3.0% |
| Immigrants | Zimbabwe | 64.2 /100 | #165 | Good 3.0% |
| Immigrants | South Eastern Asia | 62.9 /100 | #166 | Good 3.0% |
| Immigrants | Eastern Europe | 58.1 /100 | #167 | Average 3.0% |
| Immigrants | Greece | 57.9 /100 | #168 | Average 3.0% |
| Arabs | 57.6 /100 | #169 | Average 3.0% |
| Immigrants | Cabo Verde | 56.9 /100 | #170 | Average 3.0% |
| Immigrants | Ukraine | 56.6 /100 | #171 | Average 3.0% |
| Armenians | 56.0 /100 | #172 | Average 3.0% |
| Immigrants | Serbia | 51.1 /100 | #173 | Average 3.0% |
| Indonesians | 50.0 /100 | #174 | Average 3.0% |
| Immigrants | Romania | 48.4 /100 | #175 | Average 3.0% |
| Panamanians | 47.0 /100 | #176 | Average 3.0% |
| Immigrants | Philippines | 46.4 /100 | #177 | Average 3.0% |