African vs Senegalese Currently Married
COMPARE
African
Senegalese
Currently Married
Currently Married Comparison
Africans
Senegalese
41.8%
CURRENTLY MARRIED
0.0/ 100
METRIC RATING
307th/ 347
METRIC RANK
40.6%
CURRENTLY MARRIED
0.0/ 100
METRIC RATING
327th/ 347
METRIC RANK
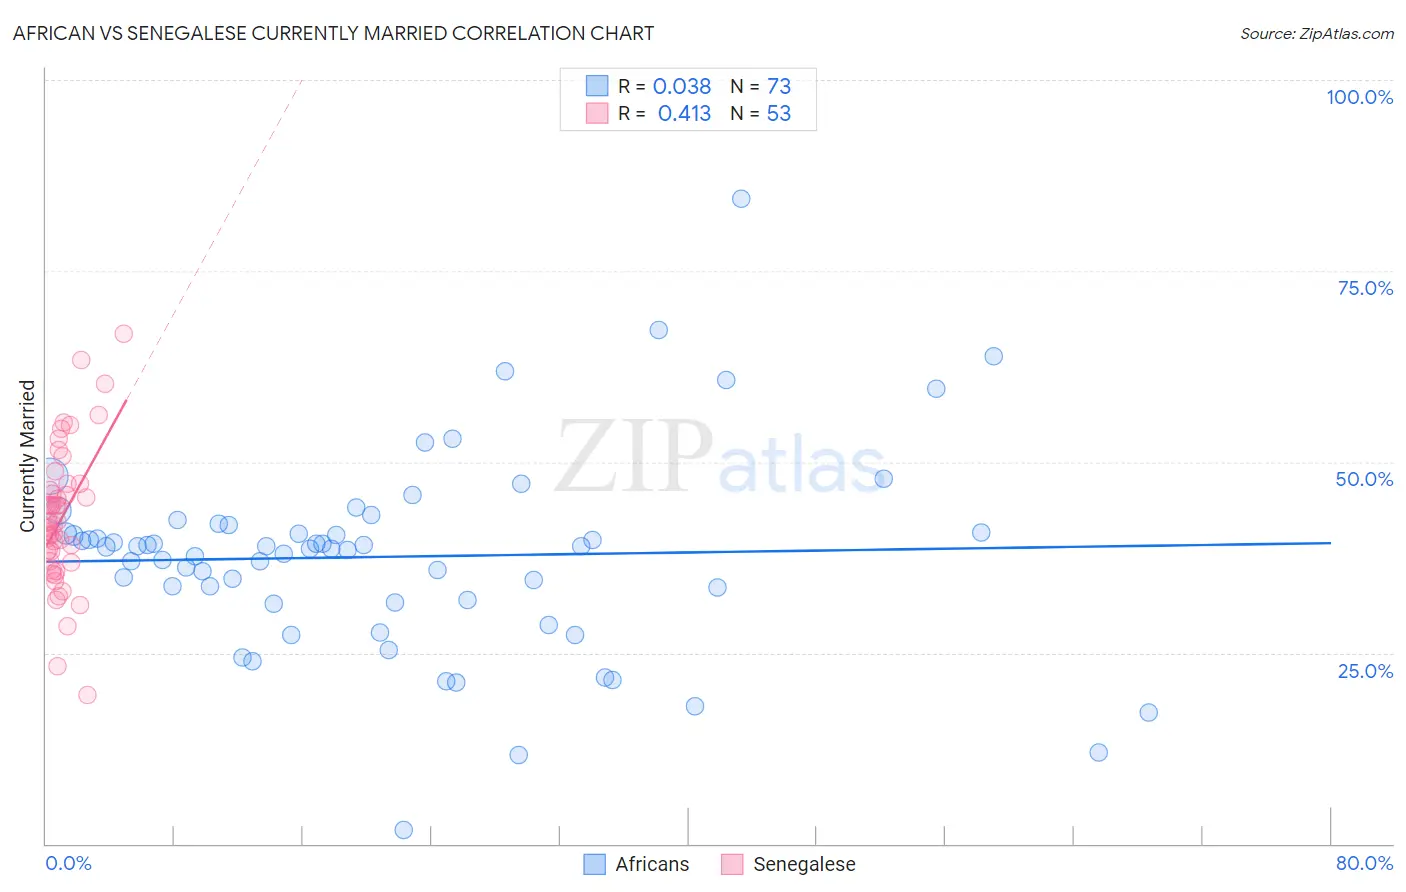
African vs Senegalese Currently Married Correlation Chart
The statistical analysis conducted on geographies consisting of 470,023,481 people shows no correlation between the proportion of Africans and percentage of population currently married in the United States with a correlation coefficient (R) of 0.038 and weighted average of 41.8%. Similarly, the statistical analysis conducted on geographies consisting of 78,135,474 people shows a moderate positive correlation between the proportion of Senegalese and percentage of population currently married in the United States with a correlation coefficient (R) of 0.413 and weighted average of 40.6%, a difference of 3.1%.
Currently Married Correlation Summary
| Measurement | African | Senegalese |
| Minimum | 1.8% | 19.4% |
| Maximum | 84.5% | 66.7% |
| Range | 82.7% | 47.3% |
| Mean | 37.6% | 42.6% |
| Median | 38.9% | 42.1% |
| Interquartile 25% (IQ1) | 31.7% | 37.0% |
| Interquartile 75% (IQ3) | 41.2% | 46.7% |
| Interquartile Range (IQR) | 9.4% | 9.7% |
| Standard Deviation (Sample) | 12.9% | 9.1% |
| Standard Deviation (Population) | 12.8% | 9.0% |
Demographics Similar to Africans and Senegalese by Currently Married
In terms of currently married, the demographic groups most similar to Africans are Immigrants from Belize (41.8%, a difference of 0.040%), Immigrants from Liberia (41.8%, a difference of 0.15%), Guyanese (41.6%, a difference of 0.52%), Trinidadian and Tobagonian (41.5%, a difference of 0.66%), and Somali (41.5%, a difference of 0.85%). Similarly, the demographic groups most similar to Senegalese are Barbadian (40.6%, a difference of 0.17%), U.S. Virgin Islander (40.7%, a difference of 0.31%), Immigrants from Senegal (40.7%, a difference of 0.36%), Immigrants from West Indies (40.7%, a difference of 0.37%), and Immigrants from Haiti (41.0%, a difference of 1.1%).
| Demographics | Rating | Rank | Currently Married |
| Africans | 0.0 /100 | #307 | Tragic 41.8% |
| Immigrants | Belize | 0.0 /100 | #308 | Tragic 41.8% |
| Immigrants | Liberia | 0.0 /100 | #309 | Tragic 41.8% |
| Guyanese | 0.0 /100 | #310 | Tragic 41.6% |
| Trinidadians and Tobagonians | 0.0 /100 | #311 | Tragic 41.5% |
| Somalis | 0.0 /100 | #312 | Tragic 41.5% |
| Jamaicans | 0.0 /100 | #313 | Tragic 41.4% |
| West Indians | 0.0 /100 | #314 | Tragic 41.3% |
| Inupiat | 0.0 /100 | #315 | Tragic 41.3% |
| Immigrants | Caribbean | 0.0 /100 | #316 | Tragic 41.3% |
| Haitians | 0.0 /100 | #317 | Tragic 41.3% |
| Bahamians | 0.0 /100 | #318 | Tragic 41.2% |
| Immigrants | Somalia | 0.0 /100 | #319 | Tragic 41.2% |
| Immigrants | Jamaica | 0.0 /100 | #320 | Tragic 41.1% |
| Immigrants | Congo | 0.0 /100 | #321 | Tragic 41.1% |
| Immigrants | Haiti | 0.0 /100 | #322 | Tragic 41.0% |
| Immigrants | West Indies | 0.0 /100 | #323 | Tragic 40.7% |
| Immigrants | Senegal | 0.0 /100 | #324 | Tragic 40.7% |
| U.S. Virgin Islanders | 0.0 /100 | #325 | Tragic 40.7% |
| Barbadians | 0.0 /100 | #326 | Tragic 40.6% |
| Senegalese | 0.0 /100 | #327 | Tragic 40.6% |