African vs Immigrants from Poland 6th Grade
COMPARE
African
Immigrants from Poland
6th Grade
6th Grade Comparison
Africans
Immigrants from Poland
96.9%
6TH GRADE
14.8/ 100
METRIC RATING
200th/ 347
METRIC RANK
97.1%
6TH GRADE
56.2/ 100
METRIC RATING
165th/ 347
METRIC RANK
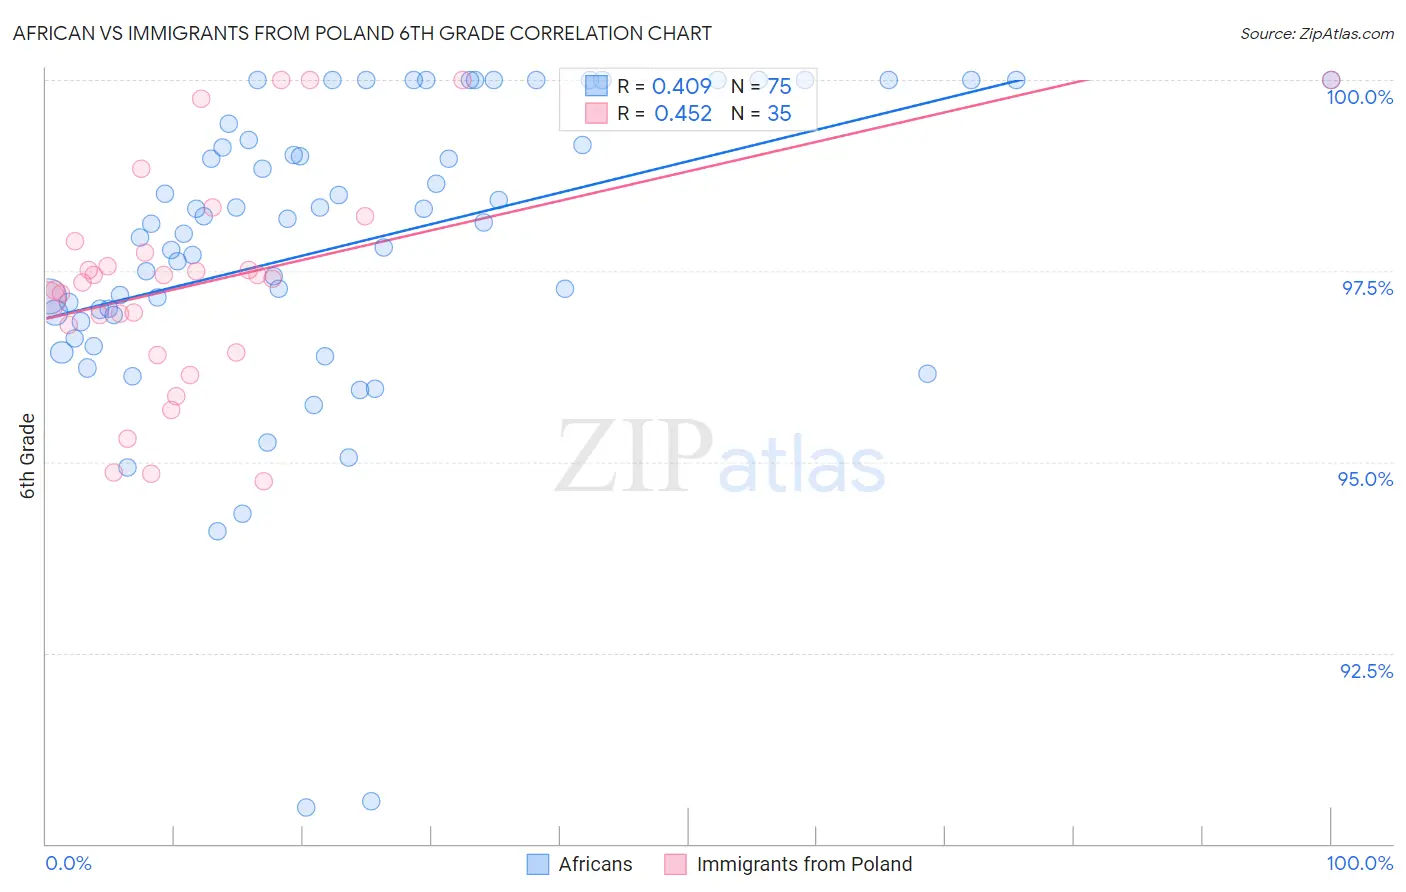
African vs Immigrants from Poland 6th Grade Correlation Chart
The statistical analysis conducted on geographies consisting of 470,094,744 people shows a moderate positive correlation between the proportion of Africans and percentage of population with at least 6th grade education in the United States with a correlation coefficient (R) of 0.409 and weighted average of 96.9%. Similarly, the statistical analysis conducted on geographies consisting of 304,861,559 people shows a moderate positive correlation between the proportion of Immigrants from Poland and percentage of population with at least 6th grade education in the United States with a correlation coefficient (R) of 0.452 and weighted average of 97.1%, a difference of 0.23%.
6th Grade Correlation Summary
| Measurement | African | Immigrants from Poland |
| Minimum | 90.5% | 94.8% |
| Maximum | 100.0% | 100.0% |
| Range | 9.5% | 5.2% |
| Mean | 97.8% | 97.4% |
| Median | 98.1% | 97.4% |
| Interquartile 25% (IQ1) | 96.9% | 96.4% |
| Interquartile 75% (IQ3) | 99.4% | 97.9% |
| Interquartile Range (IQR) | 2.5% | 1.5% |
| Standard Deviation (Sample) | 2.0% | 1.4% |
| Standard Deviation (Population) | 2.0% | 1.4% |
Similar Demographics by 6th Grade
Demographics Similar to Africans by 6th Grade
In terms of 6th grade, the demographic groups most similar to Africans are Immigrants from Zaire (96.9%, a difference of 0.0%), Immigrants from Northern Africa (96.9%, a difference of 0.010%), Immigrants from Chile (96.8%, a difference of 0.010%), Sudanese (96.8%, a difference of 0.010%), and Immigrants from Bahamas (96.8%, a difference of 0.010%).
| Demographics | Rating | Rank | 6th Grade |
| Paraguayans | 26.6 /100 | #193 | Fair 96.9% |
| Immigrants | Lebanon | 25.6 /100 | #194 | Fair 96.9% |
| Immigrants | Brazil | 25.5 /100 | #195 | Fair 96.9% |
| Immigrants | Uganda | 21.2 /100 | #196 | Fair 96.9% |
| Brazilians | 20.1 /100 | #197 | Fair 96.9% |
| Immigrants | Albania | 18.8 /100 | #198 | Poor 96.9% |
| Immigrants | Northern Africa | 15.7 /100 | #199 | Poor 96.9% |
| Africans | 14.8 /100 | #200 | Poor 96.9% |
| Immigrants | Zaire | 14.5 /100 | #201 | Poor 96.9% |
| Immigrants | Chile | 14.2 /100 | #202 | Poor 96.8% |
| Sudanese | 13.9 /100 | #203 | Poor 96.8% |
| Immigrants | Bahamas | 13.8 /100 | #204 | Poor 96.8% |
| Natives/Alaskans | 13.0 /100 | #205 | Poor 96.8% |
| Laotians | 11.8 /100 | #206 | Poor 96.8% |
| Iraqis | 11.7 /100 | #207 | Poor 96.8% |
Demographics Similar to Immigrants from Poland by 6th Grade
In terms of 6th grade, the demographic groups most similar to Immigrants from Poland are Albanian (97.1%, a difference of 0.010%), Immigrants from Korea (97.1%, a difference of 0.010%), Immigrants from Italy (97.1%, a difference of 0.010%), Apache (97.1%, a difference of 0.010%), and Immigrants from Taiwan (97.1%, a difference of 0.010%).
| Demographics | Rating | Rank | 6th Grade |
| Immigrants | Iran | 63.3 /100 | #158 | Good 97.1% |
| Kenyans | 62.9 /100 | #159 | Good 97.1% |
| Ugandans | 62.2 /100 | #160 | Good 97.1% |
| Immigrants | Belarus | 60.4 /100 | #161 | Good 97.1% |
| Marshallese | 60.2 /100 | #162 | Good 97.1% |
| Albanians | 57.8 /100 | #163 | Average 97.1% |
| Immigrants | Korea | 57.7 /100 | #164 | Average 97.1% |
| Immigrants | Poland | 56.2 /100 | #165 | Average 97.1% |
| Immigrants | Italy | 53.8 /100 | #166 | Average 97.1% |
| Apache | 53.6 /100 | #167 | Average 97.1% |
| Immigrants | Taiwan | 53.5 /100 | #168 | Average 97.1% |
| Bermudans | 52.6 /100 | #169 | Average 97.1% |
| Chileans | 52.1 /100 | #170 | Average 97.1% |
| Immigrants | Sri Lanka | 51.7 /100 | #171 | Average 97.1% |
| Egyptians | 50.9 /100 | #172 | Average 97.1% |