Immigrants from Jordan vs Immigrants from Poland Median Female Earnings
COMPARE
Immigrants from Jordan
Immigrants from Poland
Median Female Earnings
Median Female Earnings Comparison
Immigrants from Jordan
Immigrants from Poland
$40,977
MEDIAN FEMALE EARNINGS
93.5/ 100
METRIC RATING
122nd/ 347
METRIC RANK
$41,630
MEDIAN FEMALE EARNINGS
98.2/ 100
METRIC RATING
102nd/ 347
METRIC RANK
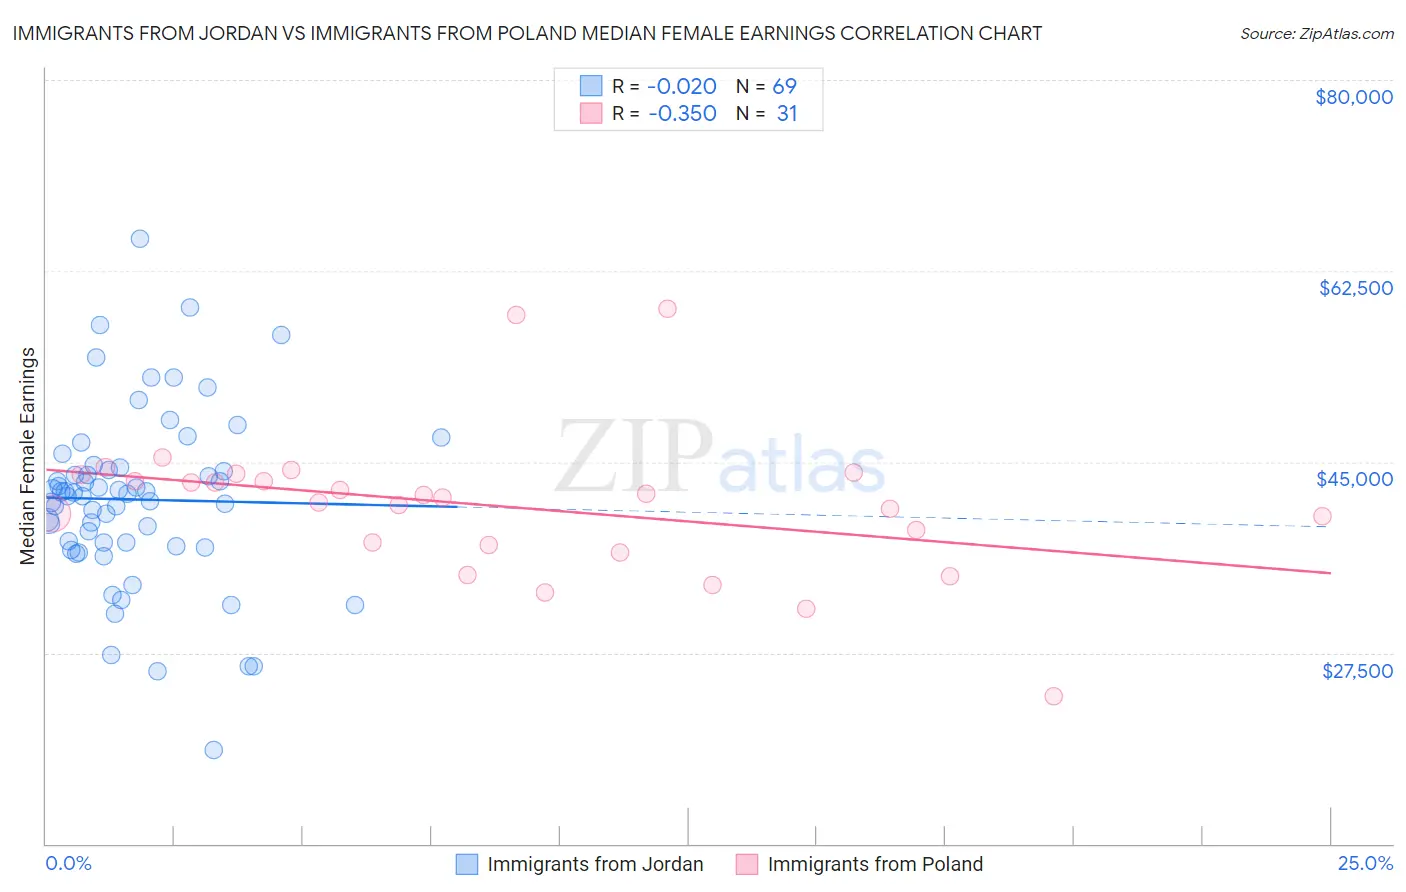
Immigrants from Jordan vs Immigrants from Poland Median Female Earnings Correlation Chart
The statistical analysis conducted on geographies consisting of 181,274,544 people shows no correlation between the proportion of Immigrants from Jordan and median female earnings in the United States with a correlation coefficient (R) of -0.020 and weighted average of $40,977. Similarly, the statistical analysis conducted on geographies consisting of 304,768,563 people shows a mild negative correlation between the proportion of Immigrants from Poland and median female earnings in the United States with a correlation coefficient (R) of -0.350 and weighted average of $41,630, a difference of 1.6%.
Median Female Earnings Correlation Summary
| Measurement | Immigrants from Jordan | Immigrants from Poland |
| Minimum | $18,558 | $23,547 |
| Maximum | $65,466 | $59,042 |
| Range | $46,908 | $35,495 |
| Mean | $41,547 | $40,933 |
| Median | $42,113 | $41,694 |
| Interquartile 25% (IQ1) | $37,412 | $37,434 |
| Interquartile 75% (IQ3) | $44,413 | $43,838 |
| Interquartile Range (IQR) | $7,001 | $6,404 |
| Standard Deviation (Sample) | $8,068 | $6,744 |
| Standard Deviation (Population) | $8,010 | $6,634 |
Demographics Similar to Immigrants from Jordan and Immigrants from Poland by Median Female Earnings
In terms of median female earnings, the demographic groups most similar to Immigrants from Jordan are Croatian ($40,993, a difference of 0.040%), Immigrants from Kuwait ($41,055, a difference of 0.19%), Immigrants from Philippines ($41,114, a difference of 0.33%), Immigrants from Lebanon ($41,183, a difference of 0.50%), and Barbadian ($41,261, a difference of 0.69%). Similarly, the demographic groups most similar to Immigrants from Poland are Immigrants from Argentina ($41,554, a difference of 0.18%), Immigrants from Zimbabwe ($41,527, a difference of 0.25%), Italian ($41,505, a difference of 0.30%), Immigrants from Eritrea ($41,485, a difference of 0.35%), and Palestinian ($41,484, a difference of 0.35%).
| Demographics | Rating | Rank | Median Female Earnings |
| Immigrants | Poland | 98.2 /100 | #102 | Exceptional $41,630 |
| Immigrants | Argentina | 97.9 /100 | #103 | Exceptional $41,554 |
| Immigrants | Zimbabwe | 97.8 /100 | #104 | Exceptional $41,527 |
| Italians | 97.7 /100 | #105 | Exceptional $41,505 |
| Immigrants | Eritrea | 97.6 /100 | #106 | Exceptional $41,485 |
| Palestinians | 97.6 /100 | #107 | Exceptional $41,484 |
| Jordanians | 97.5 /100 | #108 | Exceptional $41,464 |
| Chinese | 97.5 /100 | #109 | Exceptional $41,461 |
| Immigrants | Western Asia | 97.0 /100 | #110 | Exceptional $41,375 |
| Immigrants | Canada | 97.0 /100 | #111 | Exceptional $41,373 |
| Immigrants | North America | 96.7 /100 | #112 | Exceptional $41,319 |
| Macedonians | 96.4 /100 | #113 | Exceptional $41,286 |
| Immigrants | England | 96.4 /100 | #114 | Exceptional $41,277 |
| Koreans | 96.4 /100 | #115 | Exceptional $41,276 |
| Immigrants | Brazil | 96.4 /100 | #116 | Exceptional $41,273 |
| Barbadians | 96.3 /100 | #117 | Exceptional $41,261 |
| Immigrants | Lebanon | 95.6 /100 | #118 | Exceptional $41,183 |
| Immigrants | Philippines | 95.0 /100 | #119 | Exceptional $41,114 |
| Immigrants | Kuwait | 94.4 /100 | #120 | Exceptional $41,055 |
| Croatians | 93.7 /100 | #121 | Exceptional $40,993 |
| Immigrants | Jordan | 93.5 /100 | #122 | Exceptional $40,977 |