Potawatomi vs Immigrants from Poland Median Female Earnings
COMPARE
Potawatomi
Immigrants from Poland
Median Female Earnings
Median Female Earnings Comparison
Potawatomi
Immigrants from Poland
$34,739
MEDIAN FEMALE EARNINGS
0.0/ 100
METRIC RATING
317th/ 347
METRIC RANK
$41,630
MEDIAN FEMALE EARNINGS
98.2/ 100
METRIC RATING
102nd/ 347
METRIC RANK
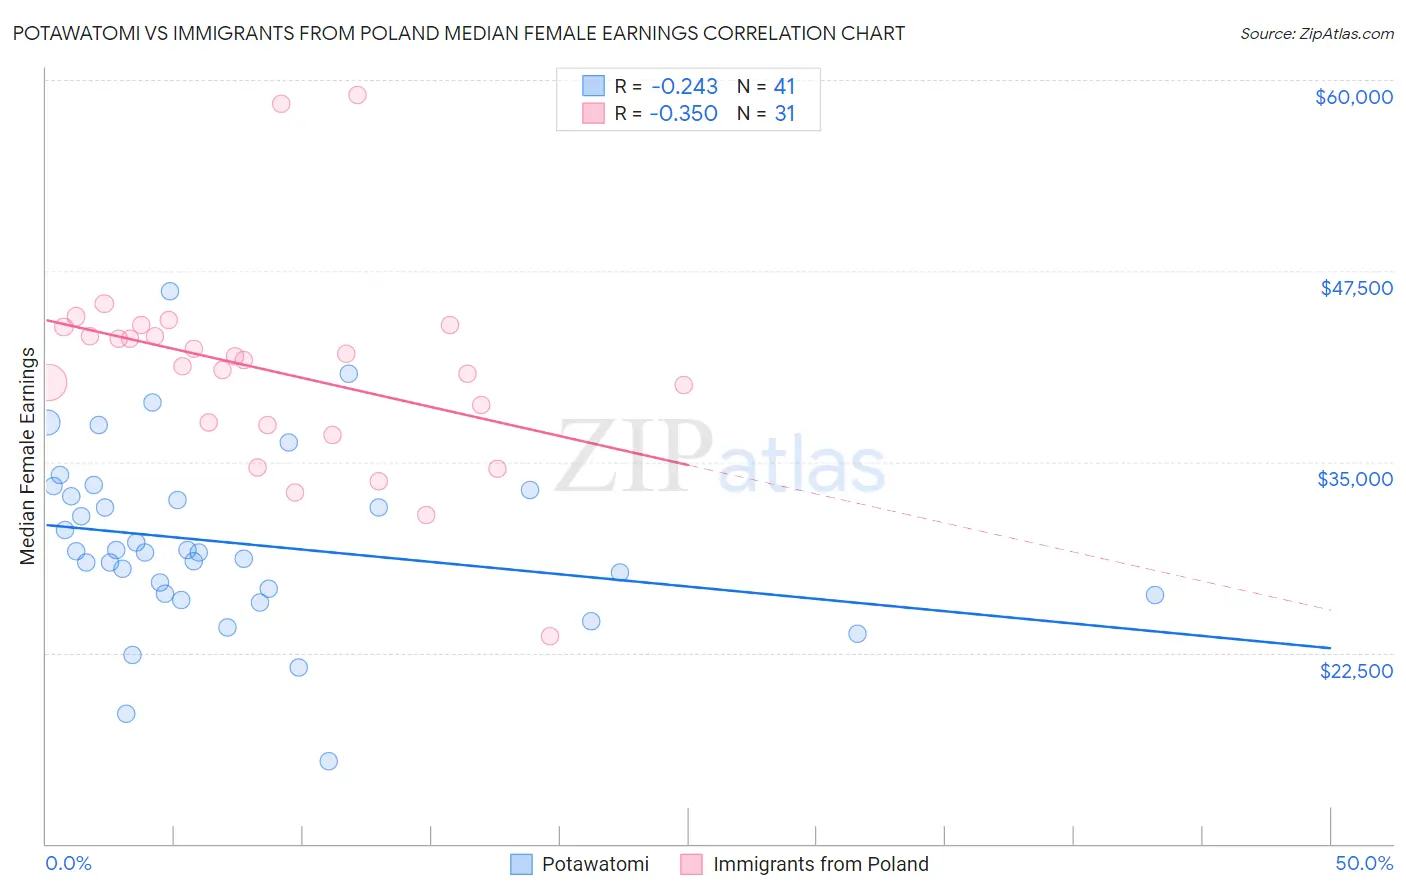
Potawatomi vs Immigrants from Poland Median Female Earnings Correlation Chart
The statistical analysis conducted on geographies consisting of 117,757,146 people shows a weak negative correlation between the proportion of Potawatomi and median female earnings in the United States with a correlation coefficient (R) of -0.243 and weighted average of $34,739. Similarly, the statistical analysis conducted on geographies consisting of 304,768,563 people shows a mild negative correlation between the proportion of Immigrants from Poland and median female earnings in the United States with a correlation coefficient (R) of -0.350 and weighted average of $41,630, a difference of 19.8%.
Median Female Earnings Correlation Summary
| Measurement | Potawatomi | Immigrants from Poland |
| Minimum | $15,417 | $23,547 |
| Maximum | $46,172 | $59,042 |
| Range | $30,755 | $35,495 |
| Mean | $29,667 | $40,933 |
| Median | $29,066 | $41,694 |
| Interquartile 25% (IQ1) | $26,292 | $37,434 |
| Interquartile 75% (IQ3) | $32,931 | $43,838 |
| Interquartile Range (IQR) | $6,639 | $6,404 |
| Standard Deviation (Sample) | $5,830 | $6,744 |
| Standard Deviation (Population) | $5,758 | $6,634 |
Similar Demographics by Median Female Earnings
Demographics Similar to Potawatomi by Median Female Earnings
In terms of median female earnings, the demographic groups most similar to Potawatomi are Cherokee ($34,742, a difference of 0.010%), Immigrants from Yemen ($34,693, a difference of 0.13%), Pennsylvania German ($34,802, a difference of 0.18%), Shoshone ($34,677, a difference of 0.18%), and Immigrants from Honduras ($34,647, a difference of 0.27%).
| Demographics | Rating | Rank | Median Female Earnings |
| Chippewa | 0.0 /100 | #310 | Tragic $35,003 |
| Ute | 0.0 /100 | #311 | Tragic $34,960 |
| Yaqui | 0.0 /100 | #312 | Tragic $34,943 |
| Cubans | 0.0 /100 | #313 | Tragic $34,942 |
| Apache | 0.0 /100 | #314 | Tragic $34,895 |
| Pennsylvania Germans | 0.0 /100 | #315 | Tragic $34,802 |
| Cherokee | 0.0 /100 | #316 | Tragic $34,742 |
| Potawatomi | 0.0 /100 | #317 | Tragic $34,739 |
| Immigrants | Yemen | 0.0 /100 | #318 | Tragic $34,693 |
| Shoshone | 0.0 /100 | #319 | Tragic $34,677 |
| Immigrants | Honduras | 0.0 /100 | #320 | Tragic $34,647 |
| Hispanics or Latinos | 0.0 /100 | #321 | Tragic $34,421 |
| Chickasaw | 0.0 /100 | #322 | Tragic $34,414 |
| Seminole | 0.0 /100 | #323 | Tragic $34,385 |
| Immigrants | Congo | 0.0 /100 | #324 | Tragic $34,317 |
Demographics Similar to Immigrants from Poland by Median Female Earnings
In terms of median female earnings, the demographic groups most similar to Immigrants from Poland are Immigrants from Fiji ($41,656, a difference of 0.060%), Romanian ($41,663, a difference of 0.080%), Immigrants from Barbados ($41,685, a difference of 0.13%), Immigrants from Argentina ($41,554, a difference of 0.18%), and Immigrants from Zimbabwe ($41,527, a difference of 0.25%).
| Demographics | Rating | Rank | Median Female Earnings |
| Immigrants | Netherlands | 98.9 /100 | #95 | Exceptional $41,870 |
| South Africans | 98.8 /100 | #96 | Exceptional $41,825 |
| Immigrants | Hungary | 98.8 /100 | #97 | Exceptional $41,820 |
| Immigrants | Scotland | 98.7 /100 | #98 | Exceptional $41,771 |
| Immigrants | Barbados | 98.4 /100 | #99 | Exceptional $41,685 |
| Romanians | 98.3 /100 | #100 | Exceptional $41,663 |
| Immigrants | Fiji | 98.3 /100 | #101 | Exceptional $41,656 |
| Immigrants | Poland | 98.2 /100 | #102 | Exceptional $41,630 |
| Immigrants | Argentina | 97.9 /100 | #103 | Exceptional $41,554 |
| Immigrants | Zimbabwe | 97.8 /100 | #104 | Exceptional $41,527 |
| Italians | 97.7 /100 | #105 | Exceptional $41,505 |
| Immigrants | Eritrea | 97.6 /100 | #106 | Exceptional $41,485 |
| Palestinians | 97.6 /100 | #107 | Exceptional $41,484 |
| Jordanians | 97.5 /100 | #108 | Exceptional $41,464 |
| Chinese | 97.5 /100 | #109 | Exceptional $41,461 |