Welsh vs Immigrants from Poland Median Female Earnings
COMPARE
Welsh
Immigrants from Poland
Median Female Earnings
Median Female Earnings Comparison
Welsh
Immigrants from Poland
$37,856
MEDIAN FEMALE EARNINGS
2.1/ 100
METRIC RATING
251st/ 347
METRIC RANK
$41,630
MEDIAN FEMALE EARNINGS
98.2/ 100
METRIC RATING
102nd/ 347
METRIC RANK
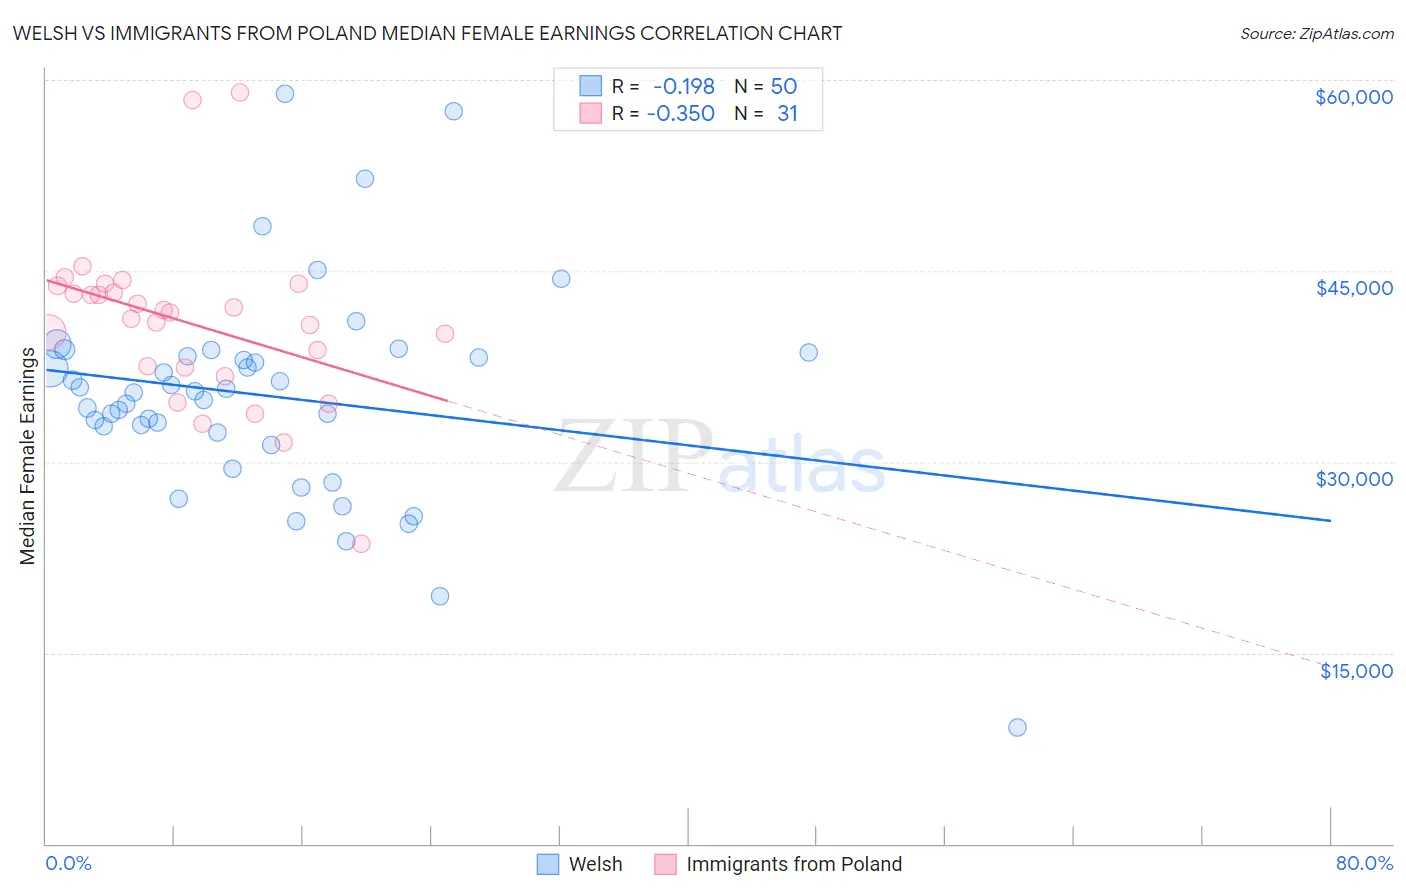
Welsh vs Immigrants from Poland Median Female Earnings Correlation Chart
The statistical analysis conducted on geographies consisting of 527,602,521 people shows a poor negative correlation between the proportion of Welsh and median female earnings in the United States with a correlation coefficient (R) of -0.198 and weighted average of $37,856. Similarly, the statistical analysis conducted on geographies consisting of 304,768,563 people shows a mild negative correlation between the proportion of Immigrants from Poland and median female earnings in the United States with a correlation coefficient (R) of -0.350 and weighted average of $41,630, a difference of 10.0%.
Median Female Earnings Correlation Summary
| Measurement | Welsh | Immigrants from Poland |
| Minimum | $9,167 | $23,547 |
| Maximum | $58,927 | $59,042 |
| Range | $49,760 | $35,495 |
| Mean | $35,195 | $40,933 |
| Median | $35,531 | $41,694 |
| Interquartile 25% (IQ1) | $32,290 | $37,434 |
| Interquartile 75% (IQ3) | $38,296 | $43,838 |
| Interquartile Range (IQR) | $6,005 | $6,404 |
| Standard Deviation (Sample) | $8,494 | $6,744 |
| Standard Deviation (Population) | $8,409 | $6,634 |
Similar Demographics by Median Female Earnings
Demographics Similar to Welsh by Median Female Earnings
In terms of median female earnings, the demographic groups most similar to Welsh are Immigrants from Iraq ($37,864, a difference of 0.020%), Immigrants from Dominica ($37,825, a difference of 0.080%), Alaskan Athabascan ($37,905, a difference of 0.13%), Swiss ($37,904, a difference of 0.13%), and Immigrants from Somalia ($37,914, a difference of 0.15%).
| Demographics | Rating | Rank | Median Female Earnings |
| Immigrants | Liberia | 2.7 /100 | #244 | Tragic $37,970 |
| Immigrants | Middle Africa | 2.7 /100 | #245 | Tragic $37,965 |
| Delaware | 2.6 /100 | #246 | Tragic $37,964 |
| Immigrants | Somalia | 2.4 /100 | #247 | Tragic $37,914 |
| Alaskan Athabascans | 2.3 /100 | #248 | Tragic $37,905 |
| Swiss | 2.3 /100 | #249 | Tragic $37,904 |
| Immigrants | Iraq | 2.2 /100 | #250 | Tragic $37,864 |
| Welsh | 2.1 /100 | #251 | Tragic $37,856 |
| Immigrants | Dominica | 2.0 /100 | #252 | Tragic $37,825 |
| Danes | 1.6 /100 | #253 | Tragic $37,730 |
| Whites/Caucasians | 1.1 /100 | #254 | Tragic $37,531 |
| Colville | 1.1 /100 | #255 | Tragic $37,514 |
| Samoans | 1.0 /100 | #256 | Tragic $37,498 |
| Hawaiians | 1.0 /100 | #257 | Tragic $37,497 |
| Belizeans | 0.9 /100 | #258 | Tragic $37,429 |
Demographics Similar to Immigrants from Poland by Median Female Earnings
In terms of median female earnings, the demographic groups most similar to Immigrants from Poland are Immigrants from Fiji ($41,656, a difference of 0.060%), Romanian ($41,663, a difference of 0.080%), Immigrants from Barbados ($41,685, a difference of 0.13%), Immigrants from Argentina ($41,554, a difference of 0.18%), and Immigrants from Zimbabwe ($41,527, a difference of 0.25%).
| Demographics | Rating | Rank | Median Female Earnings |
| Immigrants | Netherlands | 98.9 /100 | #95 | Exceptional $41,870 |
| South Africans | 98.8 /100 | #96 | Exceptional $41,825 |
| Immigrants | Hungary | 98.8 /100 | #97 | Exceptional $41,820 |
| Immigrants | Scotland | 98.7 /100 | #98 | Exceptional $41,771 |
| Immigrants | Barbados | 98.4 /100 | #99 | Exceptional $41,685 |
| Romanians | 98.3 /100 | #100 | Exceptional $41,663 |
| Immigrants | Fiji | 98.3 /100 | #101 | Exceptional $41,656 |
| Immigrants | Poland | 98.2 /100 | #102 | Exceptional $41,630 |
| Immigrants | Argentina | 97.9 /100 | #103 | Exceptional $41,554 |
| Immigrants | Zimbabwe | 97.8 /100 | #104 | Exceptional $41,527 |
| Italians | 97.7 /100 | #105 | Exceptional $41,505 |
| Immigrants | Eritrea | 97.6 /100 | #106 | Exceptional $41,485 |
| Palestinians | 97.6 /100 | #107 | Exceptional $41,484 |
| Jordanians | 97.5 /100 | #108 | Exceptional $41,464 |
| Chinese | 97.5 /100 | #109 | Exceptional $41,461 |