Tongan vs Immigrants from Iraq Median Female Earnings
COMPARE
Tongan
Immigrants from Iraq
Median Female Earnings
Median Female Earnings Comparison
Tongans
Immigrants from Iraq
$38,288
MEDIAN FEMALE EARNINGS
5.1/ 100
METRIC RATING
233rd/ 347
METRIC RANK
$37,864
MEDIAN FEMALE EARNINGS
2.2/ 100
METRIC RATING
250th/ 347
METRIC RANK
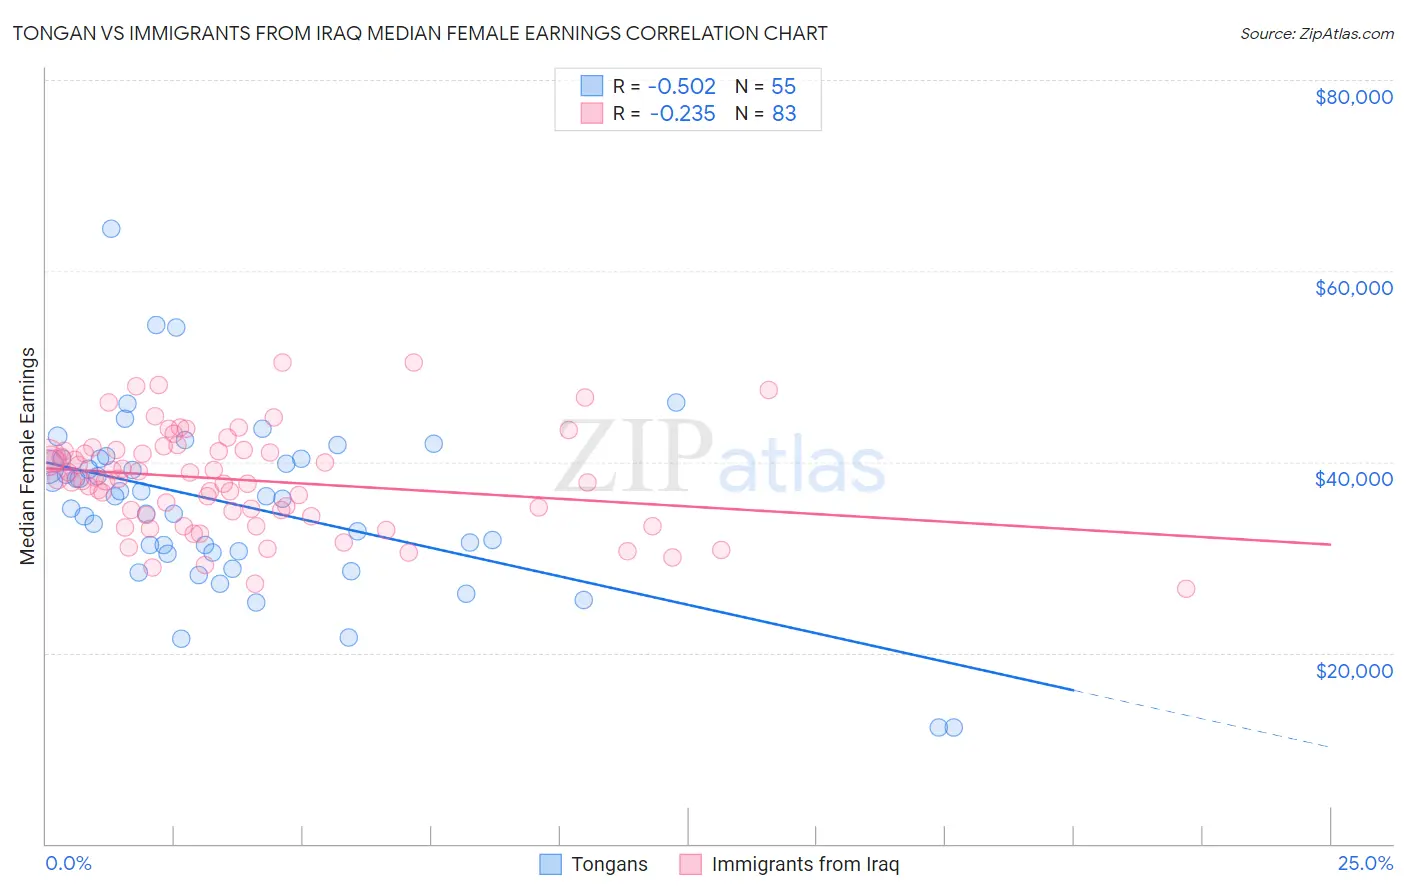
Tongan vs Immigrants from Iraq Median Female Earnings Correlation Chart
The statistical analysis conducted on geographies consisting of 102,899,109 people shows a substantial negative correlation between the proportion of Tongans and median female earnings in the United States with a correlation coefficient (R) of -0.502 and weighted average of $38,288. Similarly, the statistical analysis conducted on geographies consisting of 194,712,722 people shows a weak negative correlation between the proportion of Immigrants from Iraq and median female earnings in the United States with a correlation coefficient (R) of -0.235 and weighted average of $37,864, a difference of 1.1%.
Median Female Earnings Correlation Summary
| Measurement | Tongan | Immigrants from Iraq |
| Minimum | $12,128 | $26,764 |
| Maximum | $64,435 | $50,383 |
| Range | $52,307 | $23,619 |
| Mean | $35,533 | $38,116 |
| Median | $36,346 | $38,258 |
| Interquartile 25% (IQ1) | $30,514 | $34,416 |
| Interquartile 75% (IQ3) | $40,343 | $41,190 |
| Interquartile Range (IQR) | $9,829 | $6,774 |
| Standard Deviation (Sample) | $9,124 | $5,230 |
| Standard Deviation (Population) | $9,040 | $5,199 |
Demographics Similar to Tongans and Immigrants from Iraq by Median Female Earnings
In terms of median female earnings, the demographic groups most similar to Tongans are Celtic ($38,283, a difference of 0.010%), Scandinavian ($38,306, a difference of 0.050%), Somali ($38,333, a difference of 0.12%), Sudanese ($38,215, a difference of 0.19%), and Liberian ($38,215, a difference of 0.19%). Similarly, the demographic groups most similar to Immigrants from Iraq are Welsh ($37,856, a difference of 0.020%), Alaskan Athabascan ($37,905, a difference of 0.11%), Swiss ($37,904, a difference of 0.11%), Immigrants from Somalia ($37,914, a difference of 0.13%), and Immigrants from Middle Africa ($37,965, a difference of 0.27%).
| Demographics | Rating | Rank | Median Female Earnings |
| Somalis | 5.5 /100 | #231 | Tragic $38,333 |
| Scandinavians | 5.2 /100 | #232 | Tragic $38,306 |
| Tongans | 5.1 /100 | #233 | Tragic $38,288 |
| Celtics | 5.0 /100 | #234 | Tragic $38,283 |
| Sudanese | 4.4 /100 | #235 | Tragic $38,215 |
| Liberians | 4.4 /100 | #236 | Tragic $38,215 |
| Immigrants | Cabo Verde | 4.3 /100 | #237 | Tragic $38,208 |
| Alaska Natives | 4.3 /100 | #238 | Tragic $38,202 |
| English | 4.2 /100 | #239 | Tragic $38,196 |
| Finns | 4.0 /100 | #240 | Tragic $38,173 |
| Spanish | 3.5 /100 | #241 | Tragic $38,098 |
| Immigrants | Burma/Myanmar | 3.0 /100 | #242 | Tragic $38,028 |
| Germans | 2.8 /100 | #243 | Tragic $37,986 |
| Immigrants | Liberia | 2.7 /100 | #244 | Tragic $37,970 |
| Immigrants | Middle Africa | 2.7 /100 | #245 | Tragic $37,965 |
| Delaware | 2.6 /100 | #246 | Tragic $37,964 |
| Immigrants | Somalia | 2.4 /100 | #247 | Tragic $37,914 |
| Alaskan Athabascans | 2.3 /100 | #248 | Tragic $37,905 |
| Swiss | 2.3 /100 | #249 | Tragic $37,904 |
| Immigrants | Iraq | 2.2 /100 | #250 | Tragic $37,864 |
| Welsh | 2.1 /100 | #251 | Tragic $37,856 |