Immigrants from Central America vs Immigrants from Iraq Median Female Earnings
COMPARE
Immigrants from Central America
Immigrants from Iraq
Median Female Earnings
Median Female Earnings Comparison
Immigrants from Central America
Immigrants from Iraq
$33,953
MEDIAN FEMALE EARNINGS
0.0/ 100
METRIC RATING
328th/ 347
METRIC RANK
$37,864
MEDIAN FEMALE EARNINGS
2.2/ 100
METRIC RATING
250th/ 347
METRIC RANK
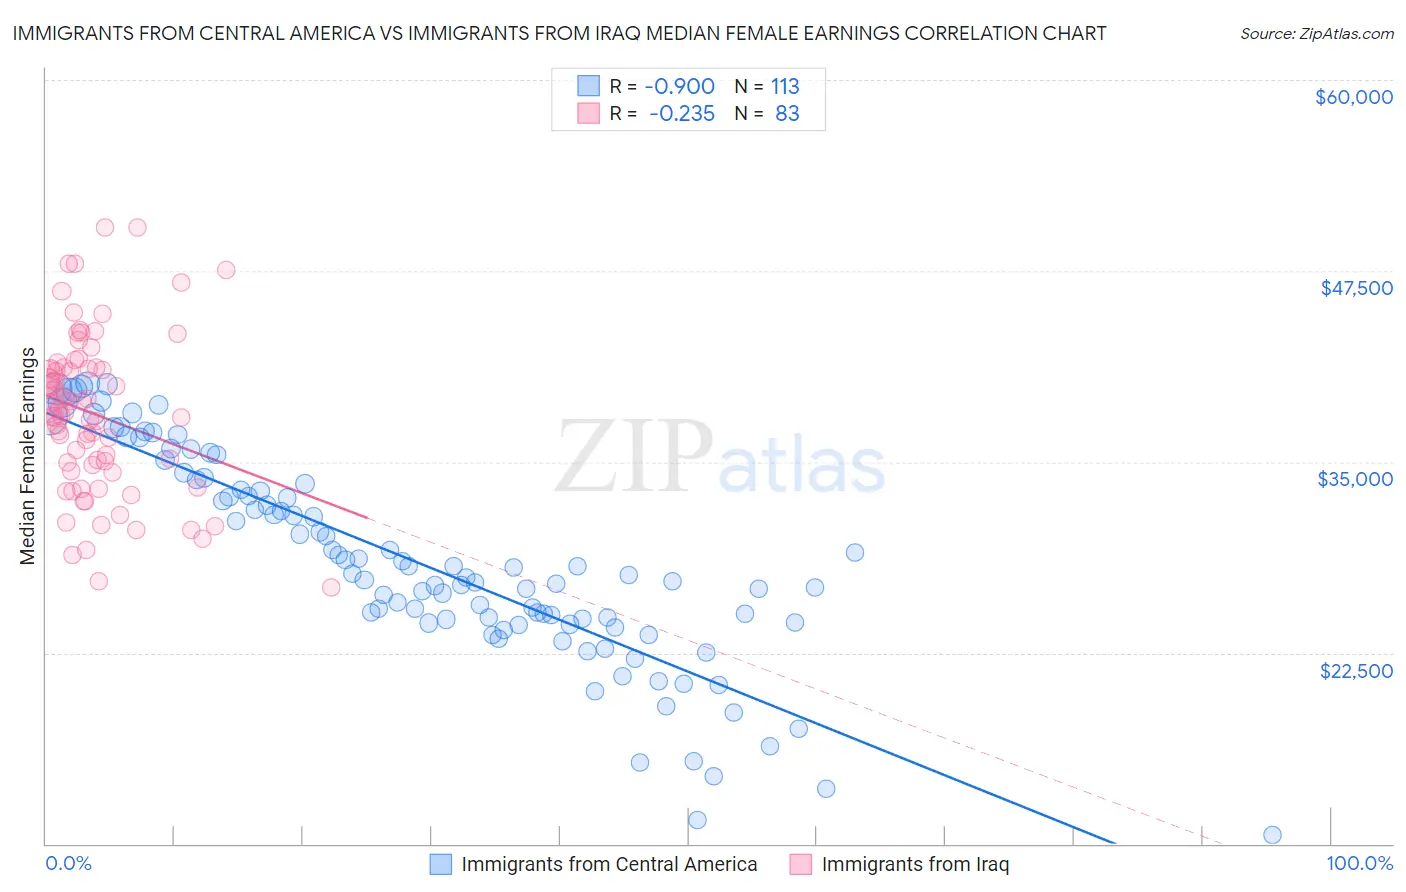
Immigrants from Central America vs Immigrants from Iraq Median Female Earnings Correlation Chart
The statistical analysis conducted on geographies consisting of 535,445,485 people shows a near-perfect negative correlation between the proportion of Immigrants from Central America and median female earnings in the United States with a correlation coefficient (R) of -0.900 and weighted average of $33,953. Similarly, the statistical analysis conducted on geographies consisting of 194,712,722 people shows a weak negative correlation between the proportion of Immigrants from Iraq and median female earnings in the United States with a correlation coefficient (R) of -0.235 and weighted average of $37,864, a difference of 11.5%.
Median Female Earnings Correlation Summary
| Measurement | Immigrants from Central America | Immigrants from Iraq |
| Minimum | $10,532 | $26,764 |
| Maximum | $40,138 | $50,383 |
| Range | $29,606 | $23,619 |
| Mean | $28,383 | $38,116 |
| Median | $27,631 | $38,258 |
| Interquartile 25% (IQ1) | $24,472 | $34,416 |
| Interquartile 75% (IQ3) | $33,368 | $41,190 |
| Interquartile Range (IQR) | $8,895 | $6,774 |
| Standard Deviation (Sample) | $6,771 | $5,230 |
| Standard Deviation (Population) | $6,741 | $5,199 |
Similar Demographics by Median Female Earnings
Demographics Similar to Immigrants from Central America by Median Female Earnings
In terms of median female earnings, the demographic groups most similar to Immigrants from Central America are Hopi ($33,932, a difference of 0.060%), Menominee ($33,894, a difference of 0.17%), Cajun ($34,034, a difference of 0.24%), Kiowa ($34,074, a difference of 0.36%), and Native/Alaskan ($33,806, a difference of 0.43%).
| Demographics | Rating | Rank | Median Female Earnings |
| Hispanics or Latinos | 0.0 /100 | #321 | Tragic $34,421 |
| Chickasaw | 0.0 /100 | #322 | Tragic $34,414 |
| Seminole | 0.0 /100 | #323 | Tragic $34,385 |
| Immigrants | Congo | 0.0 /100 | #324 | Tragic $34,317 |
| Dutch West Indians | 0.0 /100 | #325 | Tragic $34,106 |
| Kiowa | 0.0 /100 | #326 | Tragic $34,074 |
| Cajuns | 0.0 /100 | #327 | Tragic $34,034 |
| Immigrants | Central America | 0.0 /100 | #328 | Tragic $33,953 |
| Hopi | 0.0 /100 | #329 | Tragic $33,932 |
| Menominee | 0.0 /100 | #330 | Tragic $33,894 |
| Natives/Alaskans | 0.0 /100 | #331 | Tragic $33,806 |
| Choctaw | 0.0 /100 | #332 | Tragic $33,775 |
| Mexicans | 0.0 /100 | #333 | Tragic $33,664 |
| Spanish American Indians | 0.0 /100 | #334 | Tragic $33,625 |
| Creek | 0.0 /100 | #335 | Tragic $33,437 |
Demographics Similar to Immigrants from Iraq by Median Female Earnings
In terms of median female earnings, the demographic groups most similar to Immigrants from Iraq are Welsh ($37,856, a difference of 0.020%), Immigrants from Dominica ($37,825, a difference of 0.10%), Alaskan Athabascan ($37,905, a difference of 0.11%), Swiss ($37,904, a difference of 0.11%), and Immigrants from Somalia ($37,914, a difference of 0.13%).
| Demographics | Rating | Rank | Median Female Earnings |
| Germans | 2.8 /100 | #243 | Tragic $37,986 |
| Immigrants | Liberia | 2.7 /100 | #244 | Tragic $37,970 |
| Immigrants | Middle Africa | 2.7 /100 | #245 | Tragic $37,965 |
| Delaware | 2.6 /100 | #246 | Tragic $37,964 |
| Immigrants | Somalia | 2.4 /100 | #247 | Tragic $37,914 |
| Alaskan Athabascans | 2.3 /100 | #248 | Tragic $37,905 |
| Swiss | 2.3 /100 | #249 | Tragic $37,904 |
| Immigrants | Iraq | 2.2 /100 | #250 | Tragic $37,864 |
| Welsh | 2.1 /100 | #251 | Tragic $37,856 |
| Immigrants | Dominica | 2.0 /100 | #252 | Tragic $37,825 |
| Danes | 1.6 /100 | #253 | Tragic $37,730 |
| Whites/Caucasians | 1.1 /100 | #254 | Tragic $37,531 |
| Colville | 1.1 /100 | #255 | Tragic $37,514 |
| Samoans | 1.0 /100 | #256 | Tragic $37,498 |
| Hawaiians | 1.0 /100 | #257 | Tragic $37,497 |