Zimbabwean vs Immigrants from Iraq Median Female Earnings
COMPARE
Zimbabwean
Immigrants from Iraq
Median Female Earnings
Median Female Earnings Comparison
Zimbabweans
Immigrants from Iraq
$40,798
MEDIAN FEMALE EARNINGS
90.8/ 100
METRIC RATING
129th/ 347
METRIC RANK
$37,864
MEDIAN FEMALE EARNINGS
2.2/ 100
METRIC RATING
250th/ 347
METRIC RANK
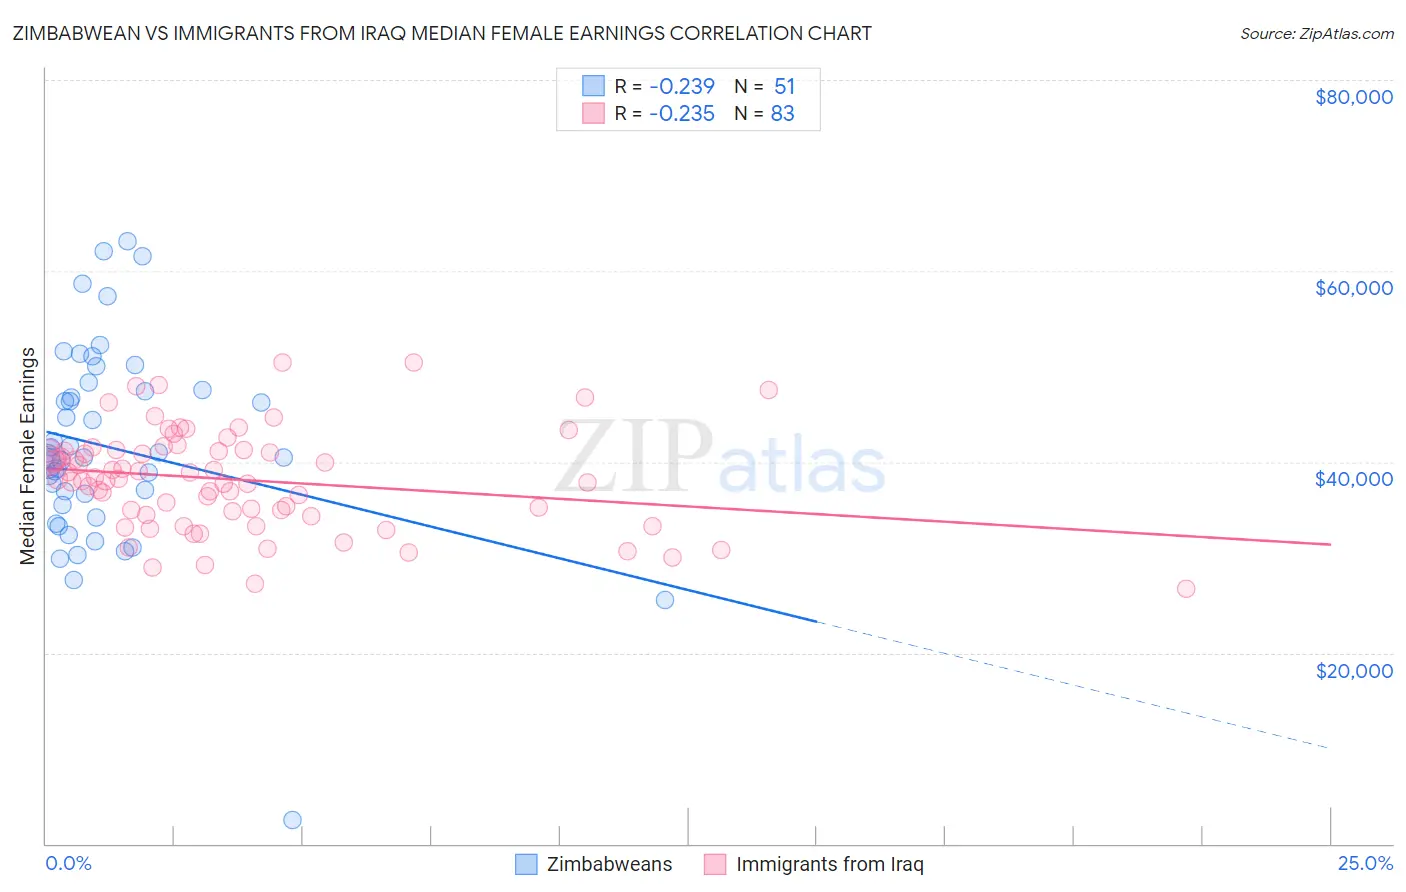
Zimbabwean vs Immigrants from Iraq Median Female Earnings Correlation Chart
The statistical analysis conducted on geographies consisting of 69,205,831 people shows a weak negative correlation between the proportion of Zimbabweans and median female earnings in the United States with a correlation coefficient (R) of -0.239 and weighted average of $40,798. Similarly, the statistical analysis conducted on geographies consisting of 194,712,722 people shows a weak negative correlation between the proportion of Immigrants from Iraq and median female earnings in the United States with a correlation coefficient (R) of -0.235 and weighted average of $37,864, a difference of 7.7%.
Median Female Earnings Correlation Summary
| Measurement | Zimbabwean | Immigrants from Iraq |
| Minimum | $2,499 | $26,764 |
| Maximum | $63,108 | $50,383 |
| Range | $60,609 | $23,619 |
| Mean | $41,512 | $38,116 |
| Median | $40,486 | $38,258 |
| Interquartile 25% (IQ1) | $35,420 | $34,416 |
| Interquartile 75% (IQ3) | $47,538 | $41,190 |
| Interquartile Range (IQR) | $12,118 | $6,774 |
| Standard Deviation (Sample) | $10,575 | $5,230 |
| Standard Deviation (Population) | $10,471 | $5,199 |
Similar Demographics by Median Female Earnings
Demographics Similar to Zimbabweans by Median Female Earnings
In terms of median female earnings, the demographic groups most similar to Zimbabweans are Immigrants from Guyana ($40,773, a difference of 0.060%), Carpatho Rusyn ($40,825, a difference of 0.070%), Chilean ($40,757, a difference of 0.10%), Immigrants from Uganda ($40,739, a difference of 0.14%), and Syrian ($40,727, a difference of 0.17%).
| Demographics | Rating | Rank | Median Female Earnings |
| Immigrants | Jordan | 93.5 /100 | #122 | Exceptional $40,977 |
| Guyanese | 93.4 /100 | #123 | Exceptional $40,973 |
| Trinidadians and Tobagonians | 93.2 /100 | #124 | Exceptional $40,958 |
| Austrians | 92.7 /100 | #125 | Exceptional $40,923 |
| Immigrants | Trinidad and Tobago | 92.3 /100 | #126 | Exceptional $40,895 |
| Ugandans | 92.2 /100 | #127 | Exceptional $40,889 |
| Carpatho Rusyns | 91.2 /100 | #128 | Exceptional $40,825 |
| Zimbabweans | 90.8 /100 | #129 | Exceptional $40,798 |
| Immigrants | Guyana | 90.3 /100 | #130 | Exceptional $40,773 |
| Chileans | 90.0 /100 | #131 | Exceptional $40,757 |
| Immigrants | Uganda | 89.7 /100 | #132 | Excellent $40,739 |
| Syrians | 89.5 /100 | #133 | Excellent $40,727 |
| Arabs | 89.3 /100 | #134 | Excellent $40,718 |
| Immigrants | Nepal | 89.0 /100 | #135 | Excellent $40,704 |
| Immigrants | Eastern Africa | 87.7 /100 | #136 | Excellent $40,644 |
Demographics Similar to Immigrants from Iraq by Median Female Earnings
In terms of median female earnings, the demographic groups most similar to Immigrants from Iraq are Welsh ($37,856, a difference of 0.020%), Immigrants from Dominica ($37,825, a difference of 0.10%), Alaskan Athabascan ($37,905, a difference of 0.11%), Swiss ($37,904, a difference of 0.11%), and Immigrants from Somalia ($37,914, a difference of 0.13%).
| Demographics | Rating | Rank | Median Female Earnings |
| Germans | 2.8 /100 | #243 | Tragic $37,986 |
| Immigrants | Liberia | 2.7 /100 | #244 | Tragic $37,970 |
| Immigrants | Middle Africa | 2.7 /100 | #245 | Tragic $37,965 |
| Delaware | 2.6 /100 | #246 | Tragic $37,964 |
| Immigrants | Somalia | 2.4 /100 | #247 | Tragic $37,914 |
| Alaskan Athabascans | 2.3 /100 | #248 | Tragic $37,905 |
| Swiss | 2.3 /100 | #249 | Tragic $37,904 |
| Immigrants | Iraq | 2.2 /100 | #250 | Tragic $37,864 |
| Welsh | 2.1 /100 | #251 | Tragic $37,856 |
| Immigrants | Dominica | 2.0 /100 | #252 | Tragic $37,825 |
| Danes | 1.6 /100 | #253 | Tragic $37,730 |
| Whites/Caucasians | 1.1 /100 | #254 | Tragic $37,531 |
| Colville | 1.1 /100 | #255 | Tragic $37,514 |
| Samoans | 1.0 /100 | #256 | Tragic $37,498 |
| Hawaiians | 1.0 /100 | #257 | Tragic $37,497 |