European vs Immigrants from Iraq Median Female Earnings
COMPARE
European
Immigrants from Iraq
Median Female Earnings
Median Female Earnings Comparison
Europeans
Immigrants from Iraq
$39,457
MEDIAN FEMALE EARNINGS
37.7/ 100
METRIC RATING
184th/ 347
METRIC RANK
$37,864
MEDIAN FEMALE EARNINGS
2.2/ 100
METRIC RATING
250th/ 347
METRIC RANK
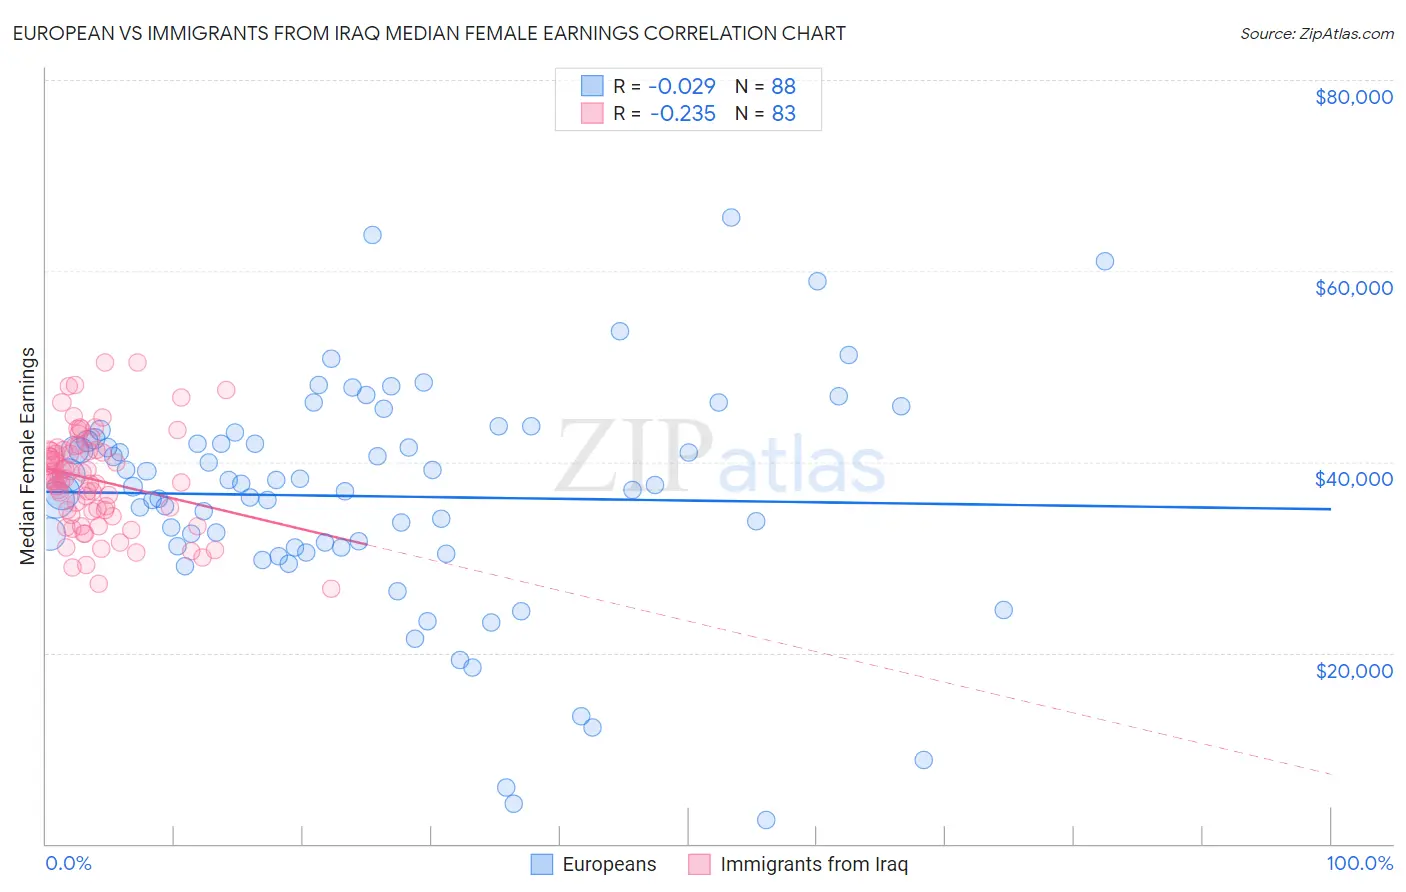
European vs Immigrants from Iraq Median Female Earnings Correlation Chart
The statistical analysis conducted on geographies consisting of 560,435,865 people shows no correlation between the proportion of Europeans and median female earnings in the United States with a correlation coefficient (R) of -0.029 and weighted average of $39,457. Similarly, the statistical analysis conducted on geographies consisting of 194,712,722 people shows a weak negative correlation between the proportion of Immigrants from Iraq and median female earnings in the United States with a correlation coefficient (R) of -0.235 and weighted average of $37,864, a difference of 4.2%.
Median Female Earnings Correlation Summary
| Measurement | European | Immigrants from Iraq |
| Minimum | $2,499 | $26,764 |
| Maximum | $65,560 | $50,383 |
| Range | $63,061 | $23,619 |
| Mean | $36,392 | $38,116 |
| Median | $37,518 | $38,258 |
| Interquartile 25% (IQ1) | $31,126 | $34,416 |
| Interquartile 75% (IQ3) | $42,307 | $41,190 |
| Interquartile Range (IQR) | $11,181 | $6,774 |
| Standard Deviation (Sample) | $11,839 | $5,230 |
| Standard Deviation (Population) | $11,771 | $5,199 |
Similar Demographics by Median Female Earnings
Demographics Similar to Europeans by Median Female Earnings
In terms of median female earnings, the demographic groups most similar to Europeans are Immigrants from West Indies ($39,441, a difference of 0.040%), Colombian ($39,439, a difference of 0.040%), Swedish ($39,421, a difference of 0.090%), Bermudan ($39,418, a difference of 0.10%), and Hungarian ($39,510, a difference of 0.13%).
| Demographics | Rating | Rank | Median Female Earnings |
| Costa Ricans | 46.1 /100 | #177 | Average $39,622 |
| Slavs | 45.6 /100 | #178 | Average $39,613 |
| Immigrants | Germany | 45.1 /100 | #179 | Average $39,603 |
| Immigrants | Kenya | 41.6 /100 | #180 | Average $39,535 |
| Tsimshian | 41.4 /100 | #181 | Average $39,530 |
| Tlingit-Haida | 40.5 /100 | #182 | Average $39,513 |
| Hungarians | 40.3 /100 | #183 | Average $39,510 |
| Europeans | 37.7 /100 | #184 | Fair $39,457 |
| Immigrants | West Indies | 36.9 /100 | #185 | Fair $39,441 |
| Colombians | 36.9 /100 | #186 | Fair $39,439 |
| Swedes | 36.0 /100 | #187 | Fair $39,421 |
| Bermudans | 35.9 /100 | #188 | Fair $39,418 |
| Senegalese | 34.2 /100 | #189 | Fair $39,384 |
| Puget Sound Salish | 33.9 /100 | #190 | Fair $39,376 |
| Immigrants | Western Africa | 32.7 /100 | #191 | Fair $39,351 |
Demographics Similar to Immigrants from Iraq by Median Female Earnings
In terms of median female earnings, the demographic groups most similar to Immigrants from Iraq are Welsh ($37,856, a difference of 0.020%), Immigrants from Dominica ($37,825, a difference of 0.10%), Alaskan Athabascan ($37,905, a difference of 0.11%), Swiss ($37,904, a difference of 0.11%), and Immigrants from Somalia ($37,914, a difference of 0.13%).
| Demographics | Rating | Rank | Median Female Earnings |
| Germans | 2.8 /100 | #243 | Tragic $37,986 |
| Immigrants | Liberia | 2.7 /100 | #244 | Tragic $37,970 |
| Immigrants | Middle Africa | 2.7 /100 | #245 | Tragic $37,965 |
| Delaware | 2.6 /100 | #246 | Tragic $37,964 |
| Immigrants | Somalia | 2.4 /100 | #247 | Tragic $37,914 |
| Alaskan Athabascans | 2.3 /100 | #248 | Tragic $37,905 |
| Swiss | 2.3 /100 | #249 | Tragic $37,904 |
| Immigrants | Iraq | 2.2 /100 | #250 | Tragic $37,864 |
| Welsh | 2.1 /100 | #251 | Tragic $37,856 |
| Immigrants | Dominica | 2.0 /100 | #252 | Tragic $37,825 |
| Danes | 1.6 /100 | #253 | Tragic $37,730 |
| Whites/Caucasians | 1.1 /100 | #254 | Tragic $37,531 |
| Colville | 1.1 /100 | #255 | Tragic $37,514 |
| Samoans | 1.0 /100 | #256 | Tragic $37,498 |
| Hawaiians | 1.0 /100 | #257 | Tragic $37,497 |