Afghan vs Immigrants from Oceania Median Family Income
COMPARE
Afghan
Immigrants from Oceania
Median Family Income
Median Family Income Comparison
Afghans
Immigrants from Oceania
$112,971
MEDIAN FAMILY INCOME
99.5/ 100
METRIC RATING
72nd/ 347
METRIC RANK
$106,453
MEDIAN FAMILY INCOME
87.3/ 100
METRIC RATING
134th/ 347
METRIC RANK
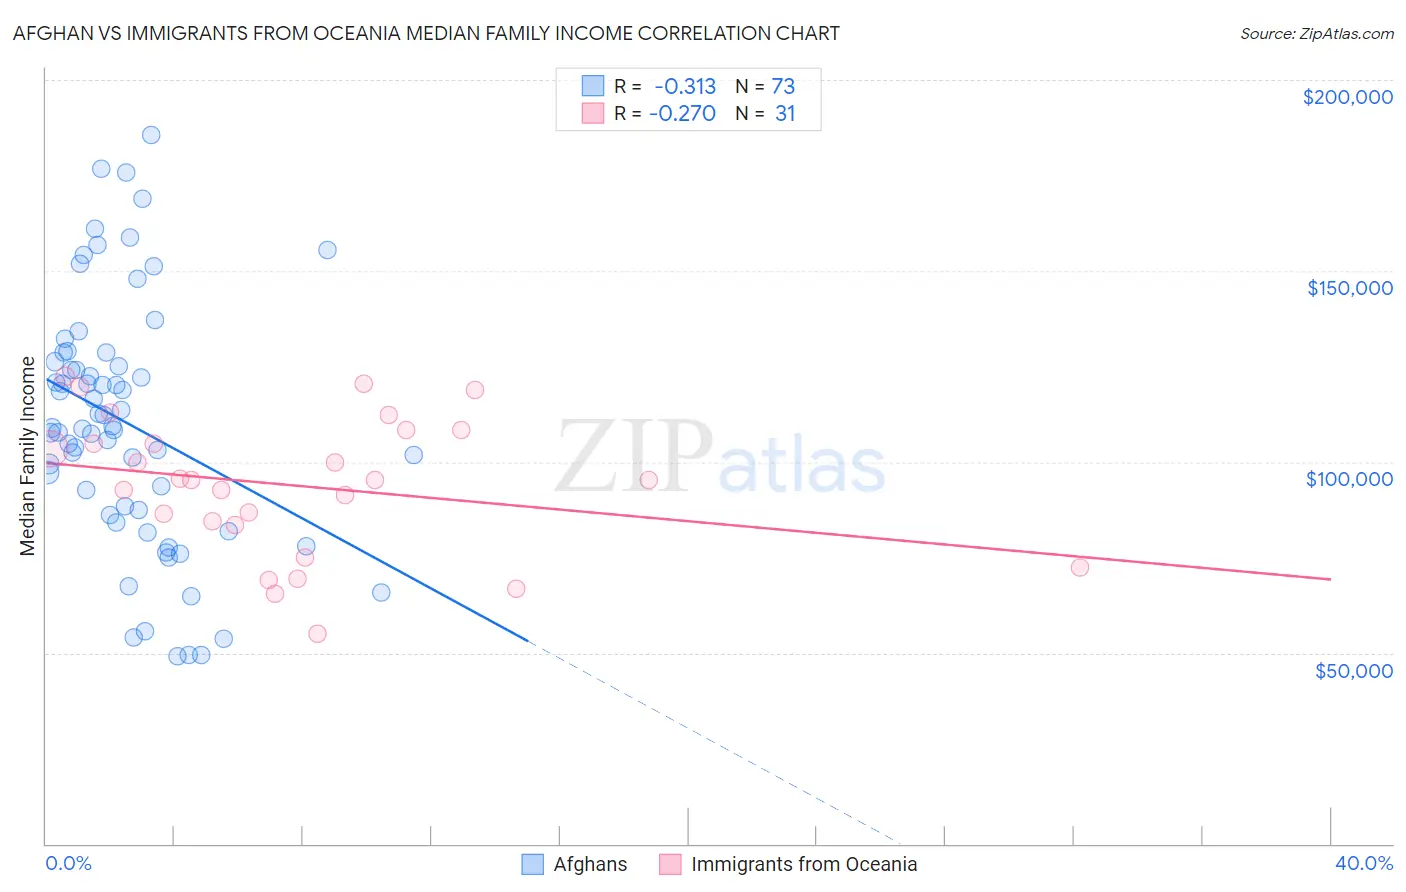
Afghan vs Immigrants from Oceania Median Family Income Correlation Chart
The statistical analysis conducted on geographies consisting of 148,816,167 people shows a mild negative correlation between the proportion of Afghans and median family income in the United States with a correlation coefficient (R) of -0.313 and weighted average of $112,971. Similarly, the statistical analysis conducted on geographies consisting of 305,332,408 people shows a weak negative correlation between the proportion of Immigrants from Oceania and median family income in the United States with a correlation coefficient (R) of -0.270 and weighted average of $106,453, a difference of 6.1%.
Median Family Income Correlation Summary
| Measurement | Afghan | Immigrants from Oceania |
| Minimum | $49,167 | $55,035 |
| Maximum | $185,438 | $122,501 |
| Range | $136,271 | $67,465 |
| Mean | $110,128 | $93,799 |
| Median | $108,924 | $95,302 |
| Interquartile 25% (IQ1) | $86,729 | $83,518 |
| Interquartile 75% (IQ3) | $127,419 | $108,312 |
| Interquartile Range (IQR) | $40,689 | $24,794 |
| Standard Deviation (Sample) | $32,416 | $17,988 |
| Standard Deviation (Population) | $32,193 | $17,696 |
Similar Demographics by Median Family Income
Demographics Similar to Afghans by Median Family Income
In terms of median family income, the demographic groups most similar to Afghans are Laotian ($112,859, a difference of 0.10%), Immigrants from Italy ($112,848, a difference of 0.11%), South African ($113,229, a difference of 0.23%), Immigrants from Western Europe ($112,688, a difference of 0.25%), and Argentinean ($112,665, a difference of 0.27%).
| Demographics | Rating | Rank | Median Family Income |
| Egyptians | 99.7 /100 | #65 | Exceptional $114,119 |
| Paraguayans | 99.7 /100 | #66 | Exceptional $114,016 |
| Immigrants | Spain | 99.7 /100 | #67 | Exceptional $113,815 |
| Immigrants | Serbia | 99.6 /100 | #68 | Exceptional $113,463 |
| Immigrants | Bulgaria | 99.6 /100 | #69 | Exceptional $113,461 |
| Immigrants | Romania | 99.6 /100 | #70 | Exceptional $113,434 |
| South Africans | 99.5 /100 | #71 | Exceptional $113,229 |
| Afghans | 99.5 /100 | #72 | Exceptional $112,971 |
| Laotians | 99.5 /100 | #73 | Exceptional $112,859 |
| Immigrants | Italy | 99.4 /100 | #74 | Exceptional $112,848 |
| Immigrants | Western Europe | 99.4 /100 | #75 | Exceptional $112,688 |
| Argentineans | 99.4 /100 | #76 | Exceptional $112,665 |
| Immigrants | Eastern Europe | 99.4 /100 | #77 | Exceptional $112,527 |
| Immigrants | Canada | 99.3 /100 | #78 | Exceptional $112,374 |
| Italians | 99.3 /100 | #79 | Exceptional $112,372 |
Demographics Similar to Immigrants from Oceania by Median Family Income
In terms of median family income, the demographic groups most similar to Immigrants from Oceania are Ugandan ($106,541, a difference of 0.080%), Immigrants from Fiji ($106,544, a difference of 0.090%), Canadian ($106,597, a difference of 0.14%), Portuguese ($106,286, a difference of 0.16%), and Immigrants from South Eastern Asia ($106,252, a difference of 0.19%).
| Demographics | Rating | Rank | Median Family Income |
| Lebanese | 90.5 /100 | #127 | Exceptional $107,086 |
| Immigrants | Ethiopia | 90.0 /100 | #128 | Excellent $106,969 |
| Arabs | 89.9 /100 | #129 | Excellent $106,952 |
| Brazilians | 89.8 /100 | #130 | Excellent $106,942 |
| Canadians | 88.1 /100 | #131 | Excellent $106,597 |
| Immigrants | Fiji | 87.8 /100 | #132 | Excellent $106,544 |
| Ugandans | 87.8 /100 | #133 | Excellent $106,541 |
| Immigrants | Oceania | 87.3 /100 | #134 | Excellent $106,453 |
| Portuguese | 86.3 /100 | #135 | Excellent $106,286 |
| Immigrants | South Eastern Asia | 86.1 /100 | #136 | Excellent $106,252 |
| Immigrants | Uganda | 85.7 /100 | #137 | Excellent $106,188 |
| Immigrants | Vietnam | 85.7 /100 | #138 | Excellent $106,186 |
| Luxembourgers | 85.7 /100 | #139 | Excellent $106,183 |
| Norwegians | 85.5 /100 | #140 | Excellent $106,144 |
| Immigrants | Syria | 85.3 /100 | #141 | Excellent $106,118 |