Afghan vs Immigrants from Ecuador Median Family Income
COMPARE
Afghan
Immigrants from Ecuador
Median Family Income
Median Family Income Comparison
Afghans
Immigrants from Ecuador
$112,971
MEDIAN FAMILY INCOME
99.5/ 100
METRIC RATING
72nd/ 347
METRIC RANK
$92,837
MEDIAN FAMILY INCOME
0.7/ 100
METRIC RATING
249th/ 347
METRIC RANK
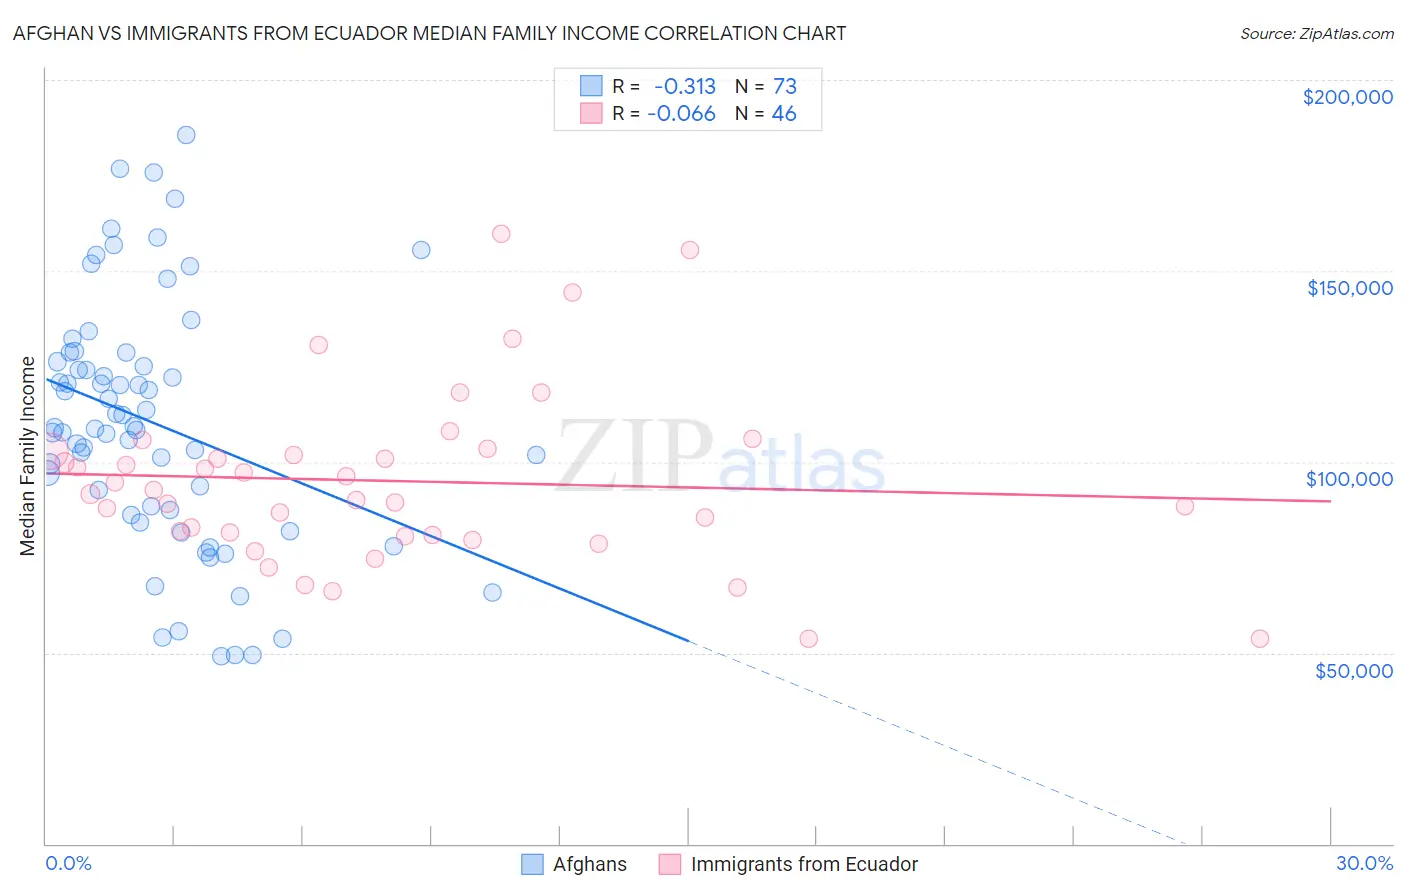
Afghan vs Immigrants from Ecuador Median Family Income Correlation Chart
The statistical analysis conducted on geographies consisting of 148,816,167 people shows a mild negative correlation between the proportion of Afghans and median family income in the United States with a correlation coefficient (R) of -0.313 and weighted average of $112,971. Similarly, the statistical analysis conducted on geographies consisting of 270,846,171 people shows a slight negative correlation between the proportion of Immigrants from Ecuador and median family income in the United States with a correlation coefficient (R) of -0.066 and weighted average of $92,837, a difference of 21.7%.
Median Family Income Correlation Summary
| Measurement | Afghan | Immigrants from Ecuador |
| Minimum | $49,167 | $53,750 |
| Maximum | $185,438 | $159,896 |
| Range | $136,271 | $106,146 |
| Mean | $110,128 | $95,020 |
| Median | $108,924 | $92,088 |
| Interquartile 25% (IQ1) | $86,729 | $80,966 |
| Interquartile 75% (IQ3) | $127,419 | $102,770 |
| Interquartile Range (IQR) | $40,689 | $21,804 |
| Standard Deviation (Sample) | $32,416 | $22,898 |
| Standard Deviation (Population) | $32,193 | $22,647 |
Similar Demographics by Median Family Income
Demographics Similar to Afghans by Median Family Income
In terms of median family income, the demographic groups most similar to Afghans are Laotian ($112,859, a difference of 0.10%), Immigrants from Italy ($112,848, a difference of 0.11%), South African ($113,229, a difference of 0.23%), Immigrants from Western Europe ($112,688, a difference of 0.25%), and Argentinean ($112,665, a difference of 0.27%).
| Demographics | Rating | Rank | Median Family Income |
| Egyptians | 99.7 /100 | #65 | Exceptional $114,119 |
| Paraguayans | 99.7 /100 | #66 | Exceptional $114,016 |
| Immigrants | Spain | 99.7 /100 | #67 | Exceptional $113,815 |
| Immigrants | Serbia | 99.6 /100 | #68 | Exceptional $113,463 |
| Immigrants | Bulgaria | 99.6 /100 | #69 | Exceptional $113,461 |
| Immigrants | Romania | 99.6 /100 | #70 | Exceptional $113,434 |
| South Africans | 99.5 /100 | #71 | Exceptional $113,229 |
| Afghans | 99.5 /100 | #72 | Exceptional $112,971 |
| Laotians | 99.5 /100 | #73 | Exceptional $112,859 |
| Immigrants | Italy | 99.4 /100 | #74 | Exceptional $112,848 |
| Immigrants | Western Europe | 99.4 /100 | #75 | Exceptional $112,688 |
| Argentineans | 99.4 /100 | #76 | Exceptional $112,665 |
| Immigrants | Eastern Europe | 99.4 /100 | #77 | Exceptional $112,527 |
| Immigrants | Canada | 99.3 /100 | #78 | Exceptional $112,374 |
| Italians | 99.3 /100 | #79 | Exceptional $112,372 |
Demographics Similar to Immigrants from Ecuador by Median Family Income
In terms of median family income, the demographic groups most similar to Immigrants from Ecuador are French American Indian ($92,872, a difference of 0.040%), Immigrants from Senegal ($92,912, a difference of 0.080%), West Indian ($92,765, a difference of 0.080%), Immigrants from Somalia ($92,609, a difference of 0.25%), and Immigrants from El Salvador ($92,545, a difference of 0.32%).
| Demographics | Rating | Rank | Median Family Income |
| Barbadians | 1.1 /100 | #242 | Tragic $93,919 |
| German Russians | 1.1 /100 | #243 | Tragic $93,858 |
| Sub-Saharan Africans | 1.0 /100 | #244 | Tragic $93,748 |
| Immigrants | Middle Africa | 1.0 /100 | #245 | Tragic $93,593 |
| Guyanese | 0.9 /100 | #246 | Tragic $93,373 |
| Immigrants | Senegal | 0.7 /100 | #247 | Tragic $92,912 |
| French American Indians | 0.7 /100 | #248 | Tragic $92,872 |
| Immigrants | Ecuador | 0.7 /100 | #249 | Tragic $92,837 |
| West Indians | 0.6 /100 | #250 | Tragic $92,765 |
| Immigrants | Somalia | 0.6 /100 | #251 | Tragic $92,609 |
| Immigrants | El Salvador | 0.6 /100 | #252 | Tragic $92,545 |
| Immigrants | Guyana | 0.6 /100 | #253 | Tragic $92,513 |
| Immigrants | Barbados | 0.5 /100 | #254 | Tragic $92,419 |
| Immigrants | Laos | 0.5 /100 | #255 | Tragic $92,239 |
| Nicaraguans | 0.5 /100 | #256 | Tragic $92,231 |