Afghan vs Immigrants from Canada Median Family Income
COMPARE
Afghan
Immigrants from Canada
Median Family Income
Median Family Income Comparison
Afghans
Immigrants from Canada
$112,971
MEDIAN FAMILY INCOME
99.5/ 100
METRIC RATING
72nd/ 347
METRIC RANK
$112,374
MEDIAN FAMILY INCOME
99.3/ 100
METRIC RATING
78th/ 347
METRIC RANK
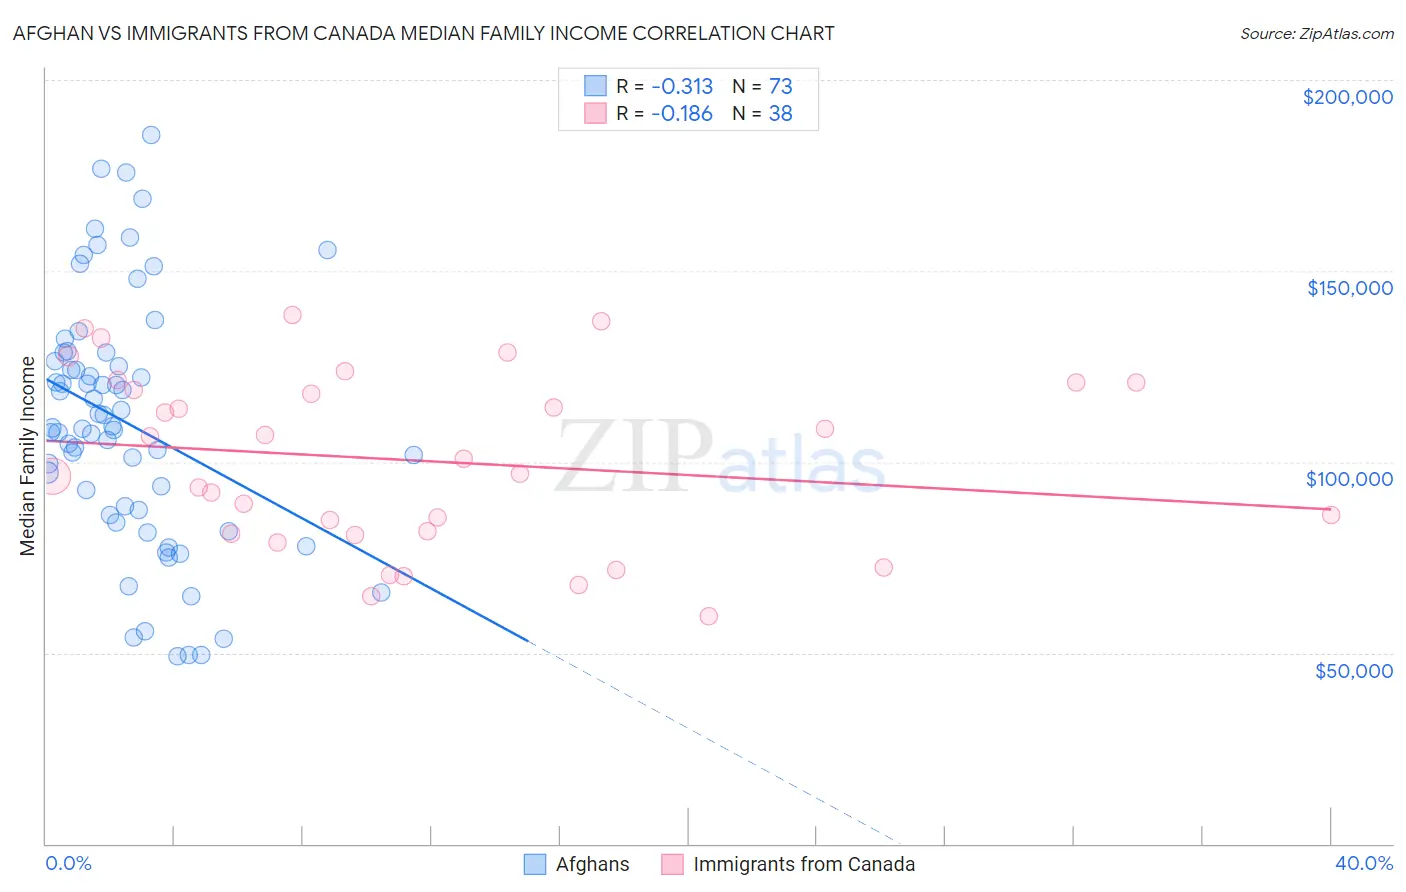
Afghan vs Immigrants from Canada Median Family Income Correlation Chart
The statistical analysis conducted on geographies consisting of 148,816,167 people shows a mild negative correlation between the proportion of Afghans and median family income in the United States with a correlation coefficient (R) of -0.313 and weighted average of $112,971. Similarly, the statistical analysis conducted on geographies consisting of 458,941,757 people shows a poor negative correlation between the proportion of Immigrants from Canada and median family income in the United States with a correlation coefficient (R) of -0.186 and weighted average of $112,374, a difference of 0.53%.
Median Family Income Correlation Summary
| Measurement | Afghan | Immigrants from Canada |
| Minimum | $49,167 | $59,444 |
| Maximum | $185,438 | $138,302 |
| Range | $136,271 | $78,858 |
| Mean | $110,128 | $100,298 |
| Median | $108,924 | $98,848 |
| Interquartile 25% (IQ1) | $86,729 | $81,159 |
| Interquartile 75% (IQ3) | $127,419 | $120,729 |
| Interquartile Range (IQR) | $40,689 | $39,570 |
| Standard Deviation (Sample) | $32,416 | $23,025 |
| Standard Deviation (Population) | $32,193 | $22,720 |
Demographics Similar to Afghans and Immigrants from Canada by Median Family Income
In terms of median family income, the demographic groups most similar to Afghans are Laotian ($112,859, a difference of 0.10%), Immigrants from Italy ($112,848, a difference of 0.11%), South African ($113,229, a difference of 0.23%), Immigrants from Western Europe ($112,688, a difference of 0.25%), and Argentinean ($112,665, a difference of 0.27%). Similarly, the demographic groups most similar to Immigrants from Canada are Italian ($112,372, a difference of 0.0%), Immigrants from Croatia ($112,323, a difference of 0.050%), Immigrants from Eastern Europe ($112,527, a difference of 0.14%), Immigrants from North America ($112,151, a difference of 0.20%), and Argentinean ($112,665, a difference of 0.26%).
| Demographics | Rating | Rank | Median Family Income |
| Egyptians | 99.7 /100 | #65 | Exceptional $114,119 |
| Paraguayans | 99.7 /100 | #66 | Exceptional $114,016 |
| Immigrants | Spain | 99.7 /100 | #67 | Exceptional $113,815 |
| Immigrants | Serbia | 99.6 /100 | #68 | Exceptional $113,463 |
| Immigrants | Bulgaria | 99.6 /100 | #69 | Exceptional $113,461 |
| Immigrants | Romania | 99.6 /100 | #70 | Exceptional $113,434 |
| South Africans | 99.5 /100 | #71 | Exceptional $113,229 |
| Afghans | 99.5 /100 | #72 | Exceptional $112,971 |
| Laotians | 99.5 /100 | #73 | Exceptional $112,859 |
| Immigrants | Italy | 99.4 /100 | #74 | Exceptional $112,848 |
| Immigrants | Western Europe | 99.4 /100 | #75 | Exceptional $112,688 |
| Argentineans | 99.4 /100 | #76 | Exceptional $112,665 |
| Immigrants | Eastern Europe | 99.4 /100 | #77 | Exceptional $112,527 |
| Immigrants | Canada | 99.3 /100 | #78 | Exceptional $112,374 |
| Italians | 99.3 /100 | #79 | Exceptional $112,372 |
| Immigrants | Croatia | 99.3 /100 | #80 | Exceptional $112,323 |
| Immigrants | North America | 99.2 /100 | #81 | Exceptional $112,151 |
| Immigrants | England | 99.2 /100 | #82 | Exceptional $112,038 |
| Immigrants | Egypt | 99.0 /100 | #83 | Exceptional $111,689 |
| Immigrants | Hungary | 98.8 /100 | #84 | Exceptional $111,378 |
| Croatians | 98.8 /100 | #85 | Exceptional $111,370 |