Croatian vs Immigrants from Oceania Median Family Income
COMPARE
Croatian
Immigrants from Oceania
Median Family Income
Median Family Income Comparison
Croatians
Immigrants from Oceania
$111,370
MEDIAN FAMILY INCOME
98.8/ 100
METRIC RATING
85th/ 347
METRIC RANK
$106,453
MEDIAN FAMILY INCOME
87.3/ 100
METRIC RATING
134th/ 347
METRIC RANK
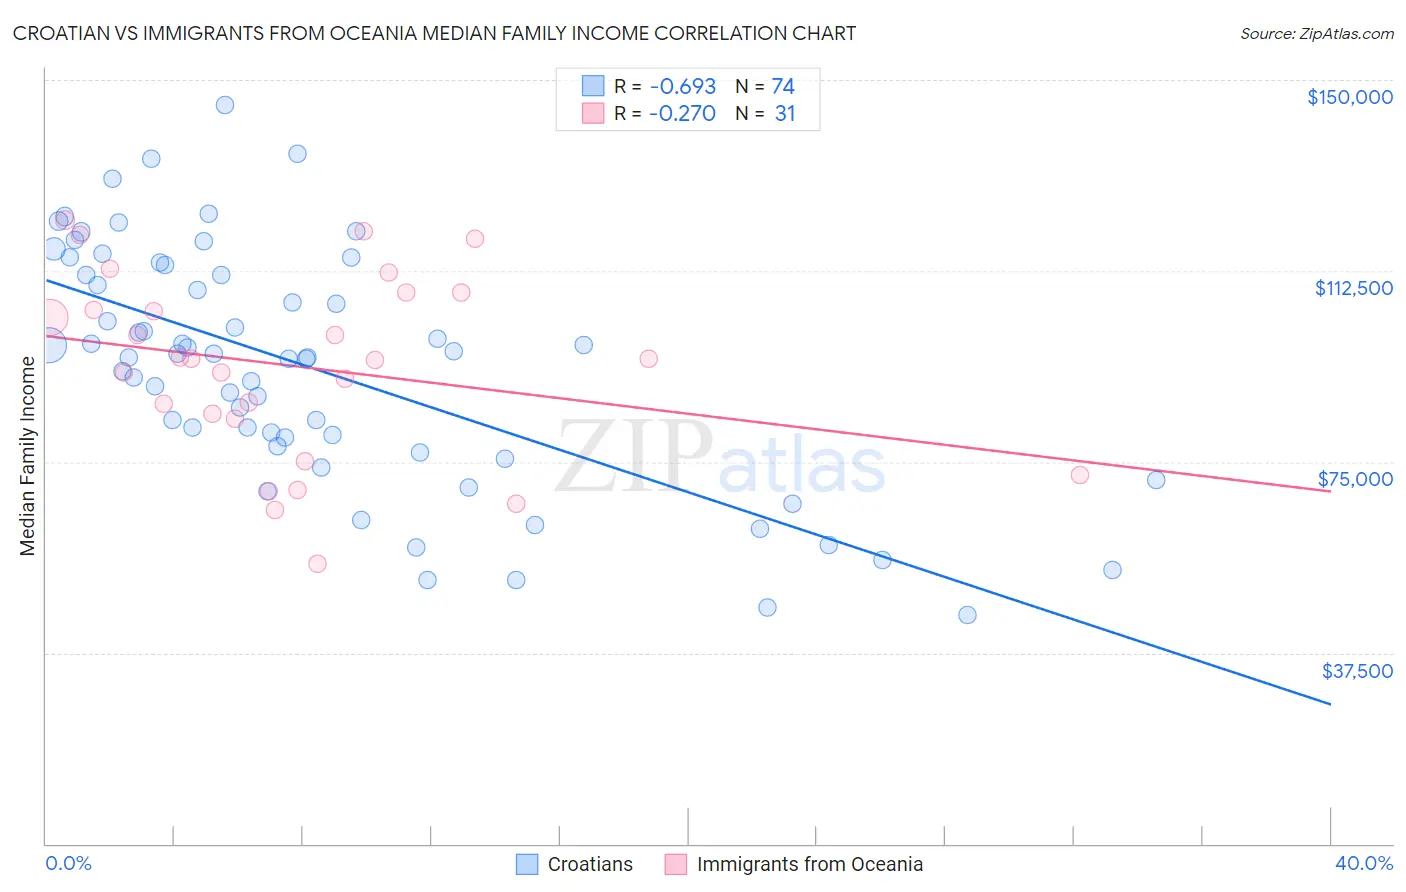
Croatian vs Immigrants from Oceania Median Family Income Correlation Chart
The statistical analysis conducted on geographies consisting of 375,427,421 people shows a significant negative correlation between the proportion of Croatians and median family income in the United States with a correlation coefficient (R) of -0.693 and weighted average of $111,370. Similarly, the statistical analysis conducted on geographies consisting of 305,332,408 people shows a weak negative correlation between the proportion of Immigrants from Oceania and median family income in the United States with a correlation coefficient (R) of -0.270 and weighted average of $106,453, a difference of 4.6%.
Median Family Income Correlation Summary
| Measurement | Croatian | Immigrants from Oceania |
| Minimum | $44,806 | $55,035 |
| Maximum | $145,180 | $122,501 |
| Range | $100,374 | $67,465 |
| Mean | $93,423 | $93,799 |
| Median | $95,958 | $95,302 |
| Interquartile 25% (IQ1) | $78,056 | $83,518 |
| Interquartile 75% (IQ3) | $111,742 | $108,312 |
| Interquartile Range (IQR) | $33,686 | $24,794 |
| Standard Deviation (Sample) | $23,244 | $17,988 |
| Standard Deviation (Population) | $23,087 | $17,696 |
Similar Demographics by Median Family Income
Demographics Similar to Croatians by Median Family Income
In terms of median family income, the demographic groups most similar to Croatians are Ukrainian ($111,368, a difference of 0.0%), Immigrants from Hungary ($111,378, a difference of 0.010%), Austrian ($111,306, a difference of 0.060%), Romanian ($111,243, a difference of 0.11%), and Immigrants from Egypt ($111,689, a difference of 0.29%).
| Demographics | Rating | Rank | Median Family Income |
| Immigrants | Canada | 99.3 /100 | #78 | Exceptional $112,374 |
| Italians | 99.3 /100 | #79 | Exceptional $112,372 |
| Immigrants | Croatia | 99.3 /100 | #80 | Exceptional $112,323 |
| Immigrants | North America | 99.2 /100 | #81 | Exceptional $112,151 |
| Immigrants | England | 99.2 /100 | #82 | Exceptional $112,038 |
| Immigrants | Egypt | 99.0 /100 | #83 | Exceptional $111,689 |
| Immigrants | Hungary | 98.8 /100 | #84 | Exceptional $111,378 |
| Croatians | 98.8 /100 | #85 | Exceptional $111,370 |
| Ukrainians | 98.8 /100 | #86 | Exceptional $111,368 |
| Austrians | 98.8 /100 | #87 | Exceptional $111,306 |
| Romanians | 98.8 /100 | #88 | Exceptional $111,243 |
| Immigrants | Argentina | 98.5 /100 | #89 | Exceptional $110,873 |
| Northern Europeans | 98.3 /100 | #90 | Exceptional $110,635 |
| Immigrants | Southern Europe | 98.3 /100 | #91 | Exceptional $110,614 |
| Immigrants | Lebanon | 97.9 /100 | #92 | Exceptional $110,159 |
Demographics Similar to Immigrants from Oceania by Median Family Income
In terms of median family income, the demographic groups most similar to Immigrants from Oceania are Ugandan ($106,541, a difference of 0.080%), Immigrants from Fiji ($106,544, a difference of 0.090%), Canadian ($106,597, a difference of 0.14%), Portuguese ($106,286, a difference of 0.16%), and Immigrants from South Eastern Asia ($106,252, a difference of 0.19%).
| Demographics | Rating | Rank | Median Family Income |
| Lebanese | 90.5 /100 | #127 | Exceptional $107,086 |
| Immigrants | Ethiopia | 90.0 /100 | #128 | Excellent $106,969 |
| Arabs | 89.9 /100 | #129 | Excellent $106,952 |
| Brazilians | 89.8 /100 | #130 | Excellent $106,942 |
| Canadians | 88.1 /100 | #131 | Excellent $106,597 |
| Immigrants | Fiji | 87.8 /100 | #132 | Excellent $106,544 |
| Ugandans | 87.8 /100 | #133 | Excellent $106,541 |
| Immigrants | Oceania | 87.3 /100 | #134 | Excellent $106,453 |
| Portuguese | 86.3 /100 | #135 | Excellent $106,286 |
| Immigrants | South Eastern Asia | 86.1 /100 | #136 | Excellent $106,252 |
| Immigrants | Uganda | 85.7 /100 | #137 | Excellent $106,188 |
| Immigrants | Vietnam | 85.7 /100 | #138 | Excellent $106,186 |
| Luxembourgers | 85.7 /100 | #139 | Excellent $106,183 |
| Norwegians | 85.5 /100 | #140 | Excellent $106,144 |
| Immigrants | Syria | 85.3 /100 | #141 | Excellent $106,118 |