Afghan vs Immigrants from Oceania Unemployment Among Ages 35 to 44 years
COMPARE
Afghan
Immigrants from Oceania
Unemployment Among Ages 35 to 44 years
Unemployment Among Ages 35 to 44 years Comparison
Afghans
Immigrants from Oceania
4.7%
UNEMPLOYMENT AMONG AGES 35 TO 44 YEARS
50.0/ 100
METRIC RATING
174th/ 347
METRIC RANK
4.8%
UNEMPLOYMENT AMONG AGES 35 TO 44 YEARS
23.2/ 100
METRIC RATING
197th/ 347
METRIC RANK
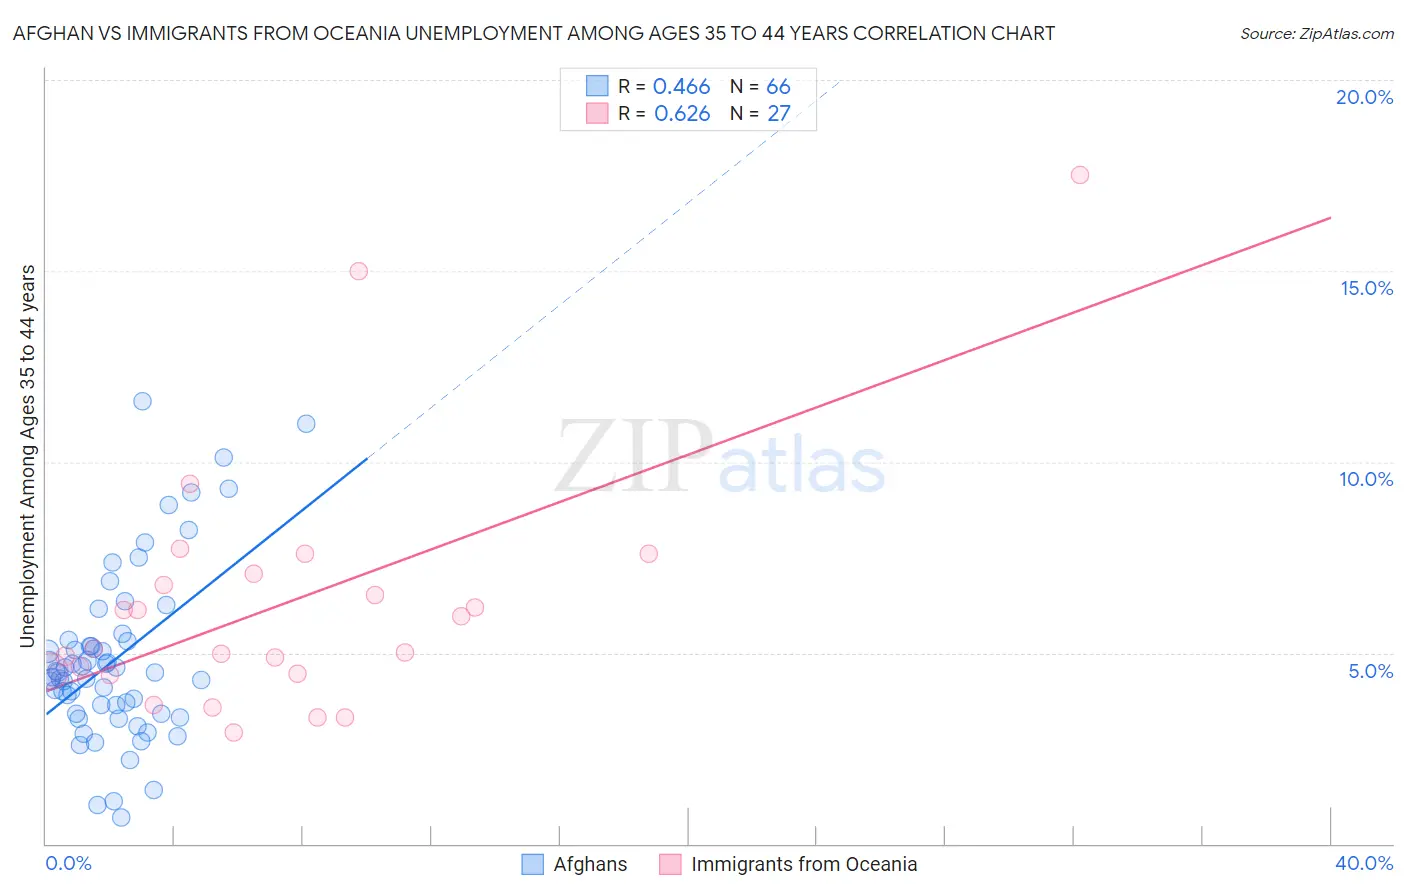
Afghan vs Immigrants from Oceania Unemployment Among Ages 35 to 44 years Correlation Chart
The statistical analysis conducted on geographies consisting of 148,051,072 people shows a moderate positive correlation between the proportion of Afghans and unemployment rate among population between the ages 35 and 44 in the United States with a correlation coefficient (R) of 0.466 and weighted average of 4.7%. Similarly, the statistical analysis conducted on geographies consisting of 300,000,559 people shows a significant positive correlation between the proportion of Immigrants from Oceania and unemployment rate among population between the ages 35 and 44 in the United States with a correlation coefficient (R) of 0.626 and weighted average of 4.8%, a difference of 2.1%.
Unemployment Among Ages 35 to 44 years Correlation Summary
| Measurement | Afghan | Immigrants from Oceania |
| Minimum | 0.70% | 2.9% |
| Maximum | 11.6% | 17.5% |
| Range | 10.9% | 14.6% |
| Mean | 4.8% | 6.3% |
| Median | 4.5% | 5.1% |
| Interquartile 25% (IQ1) | 3.4% | 4.5% |
| Interquartile 75% (IQ3) | 5.3% | 7.1% |
| Interquartile Range (IQR) | 1.9% | 2.6% |
| Standard Deviation (Sample) | 2.2% | 3.3% |
| Standard Deviation (Population) | 2.2% | 3.2% |
Similar Demographics by Unemployment Among Ages 35 to 44 years
Demographics Similar to Afghans by Unemployment Among Ages 35 to 44 years
In terms of unemployment among ages 35 to 44 years, the demographic groups most similar to Afghans are Iraqi (4.7%, a difference of 0.060%), Immigrants from Germany (4.7%, a difference of 0.080%), Lebanese (4.7%, a difference of 0.10%), Indonesian (4.7%, a difference of 0.12%), and Immigrants from Uganda (4.7%, a difference of 0.14%).
| Demographics | Rating | Rank | Unemployment Among Ages 35 to 44 years |
| Peruvians | 54.4 /100 | #167 | Average 4.7% |
| Arabs | 53.1 /100 | #168 | Average 4.7% |
| Pennsylvania Germans | 53.0 /100 | #169 | Average 4.7% |
| Immigrants | Indonesia | 52.6 /100 | #170 | Average 4.7% |
| Indonesians | 51.7 /100 | #171 | Average 4.7% |
| Lebanese | 51.4 /100 | #172 | Average 4.7% |
| Iraqis | 50.9 /100 | #173 | Average 4.7% |
| Afghans | 50.0 /100 | #174 | Average 4.7% |
| Immigrants | Germany | 48.9 /100 | #175 | Average 4.7% |
| Immigrants | Uganda | 48.1 /100 | #176 | Average 4.7% |
| Slovaks | 44.6 /100 | #177 | Average 4.7% |
| South American Indians | 40.7 /100 | #178 | Average 4.7% |
| Immigrants | South Eastern Asia | 40.2 /100 | #179 | Average 4.7% |
| Immigrants | Peru | 39.9 /100 | #180 | Fair 4.7% |
| Brazilians | 39.5 /100 | #181 | Fair 4.7% |
Demographics Similar to Immigrants from Oceania by Unemployment Among Ages 35 to 44 years
In terms of unemployment among ages 35 to 44 years, the demographic groups most similar to Immigrants from Oceania are Immigrants from Thailand (4.8%, a difference of 0.030%), Immigrants from Syria (4.8%, a difference of 0.040%), Immigrants from Middle Africa (4.8%, a difference of 0.13%), Immigrants from Ukraine (4.8%, a difference of 0.18%), and Ugandan (4.8%, a difference of 0.18%).
| Demographics | Rating | Rank | Unemployment Among Ages 35 to 44 years |
| Immigrants | Southern Europe | 33.8 /100 | #190 | Fair 4.7% |
| Immigrants | South America | 33.8 /100 | #191 | Fair 4.7% |
| Immigrants | Albania | 30.5 /100 | #192 | Fair 4.8% |
| Spanish | 30.4 /100 | #193 | Fair 4.8% |
| Koreans | 28.1 /100 | #194 | Fair 4.8% |
| Bangladeshis | 28.0 /100 | #195 | Fair 4.8% |
| Immigrants | Syria | 23.6 /100 | #196 | Fair 4.8% |
| Immigrants | Oceania | 23.2 /100 | #197 | Fair 4.8% |
| Immigrants | Thailand | 22.9 /100 | #198 | Fair 4.8% |
| Immigrants | Middle Africa | 21.9 /100 | #199 | Fair 4.8% |
| Immigrants | Ukraine | 21.4 /100 | #200 | Fair 4.8% |
| Ugandans | 21.4 /100 | #201 | Fair 4.8% |
| Immigrants | Afghanistan | 20.2 /100 | #202 | Fair 4.8% |
| Uruguayans | 20.0 /100 | #203 | Fair 4.8% |
| Immigrants | Philippines | 19.8 /100 | #204 | Poor 4.8% |