Afghan vs French Median Family Income

COMPARE

Afghan
Race
Ancestry
AfghanAfricanAlaska NativeAlaskan AthabascanAlbanianAleutAlsatianAmericanApacheArabArapahoArgentineanArmenianAssyrian/Chaldean/SyriacAustralianAustrianBahamianBangladeshiBarbadianBasqueBelgianBelizeanBermudanBhutaneseBlackfeetBolivianBrazilianBritishBritish West IndianBulgarianBurmeseCajunCambodianCanadianCape VerdeanCarpatho RusynCelticCentral AmericanCentral American IndianCherokeeCheyenneChickasawChileanChineseChippewaChoctawColombianColvilleComancheCosta RicanCreeCreekCroatianCrowCubanCypriotCzechCzechoslovakianDanishDelawareDominicanDutchDutch West IndianEastern EuropeanEcuadorianEgyptianEnglishEstonianEthiopianEuropeanFijianFilipinoFinnishFrench American IndianFrench CanadianGermanGerman RussianGhanaianGreekGuamanian/ChamorroGuatemalanGuyaneseHaitianHmongHonduranHopiHoumaHungarianIcelanderIndian (Asian)IndonesianInupiatIranianIraqiIrishIroquoisIsraeliItalianJamaicanJapaneseJordanianKenyanKiowaKoreanLaotianLatvianLebaneseLiberianLithuanianLumbeeLuxembourgerMacedonianMalaysianMalteseMarshalleseMenomineeMexicanMexican American IndianMongolianMoroccanNative HawaiianNavajoNepaleseNew ZealanderNicaraguanNigerianNorthern EuropeanNorwegianOkinawanOsageOttawaPaiutePakistaniPalestinianPanamanianParaguayanPennsylvania GermanPeruvianPimaPolishPortuguesePotawatomiPuebloPuerto RicanPuget Sound SalishRomanianRussianSalvadoranSamoanScandinavianScotch-IrishScottishSeminoleSenegaleseSerbianShoshoneSierra LeoneanSiouxSlavicSlovakSloveneSomaliSouth AfricanSouth AmericanSouth American IndianSoviet UnionSpaniardSpanishSpanish AmericanSpanish American IndianSri LankanSubsaharan AfricanSudaneseSwedishSwissSyrianTaiwaneseThaiTlingit-HaidaTohono O'OdhamTonganTrinidadian and TobagonianTsimshianTurkishU.S. Virgin IslanderUgandanUkrainianUruguayanUteVenezuelanVietnameseWelshWest IndianYakamaYaquiYugoslavianYumanYup'ikZimbabwean
Immigration
NonimmigrantsImmigrantsAfghanistanAfricaAlbaniaArgentinaArmeniaAsiaAustraliaAustriaBahamasBangladeshBarbadosBelarusBelgiumBelizeBoliviaBosnia and HerzegovinaBrazilBulgariaBurma/MyanmarCabo VerdeCambodiaCameroonCanadaCaribbeanCentral AmericaChileChinaColombiaCongoCosta RicaCroatiaCubaCzechoslovakiaDenmarkDominicaDominican RepublicEastern AfricaEastern AsiaEastern EuropeEcuadorEgyptEl SalvadorEnglandEritreaEthiopiaEuropeFijiFranceGermanyGhanaGreeceGrenadaGuatemalaGuyanaHaitiHondurasHong KongHungaryIndiaIndonesiaIranIraqIrelandIsraelItalyJamaicaJapanJordanKazakhstanKenyaKoreaKuwaitLaosLatin AmericaLatviaLebanonLiberiaLithuaniaMalaysiaMexicoMicronesiaMiddle AfricaMoldovaMoroccoNepalNetherlandsNicaraguaNigeriaNorth AmericaNorth MacedoniaNorthern AfricaNorthern EuropeNorwayOceaniaPakistanPanamaPeruPhilippinesPolandPortugalRomaniaRussiaSaudi ArabiaScotlandSenegalSerbiaSierra LeoneSingaporeSomaliaSouth AfricaSouth AmericaSouth Central AsiaSouth Eastern AsiaSouthern EuropeSpainSri LankaSt. Vincent and the GrenadinesSudanSwedenSwitzerlandSyriaTaiwanThailandTrinidad and TobagoTurkeyUgandaUkraineUruguayUzbekistanVenezuelaVietnamWest IndiesWestern AfricaWestern AsiaWestern EuropeYemenZaireZimbabweAzores
French
Race
Ancestry
AfricanAlaska NativeAlaskan AthabascanAlbanianAleutAlsatianAmericanApacheArabArapahoArgentineanArmenianAssyrian/Chaldean/SyriacAustralianAustrianBahamianBangladeshiBarbadianBasqueBelgianBelizeanBermudanBhutaneseBlackfeetBolivianBrazilianBritishBritish West IndianBulgarianBurmeseCajunCambodianCanadianCape VerdeanCarpatho RusynCelticCentral AmericanCentral American IndianCherokeeCheyenneChickasawChileanChineseChippewaChoctawColombianColvilleComancheCosta RicanCreeCreekCroatianCrowCubanCypriotCzechCzechoslovakianDanishDelawareDominicanDutchDutch West IndianEastern EuropeanEcuadorianEgyptianEnglishEstonianEthiopianEuropeanFijianFilipinoFinnishFrenchFrench American IndianFrench CanadianGermanGerman RussianGhanaianGreekGuamanian/ChamorroGuatemalanGuyaneseHaitianHmongHonduranHopiHoumaHungarianIcelanderIndian (Asian)IndonesianInupiatIranianIraqiIrishIroquoisIsraeliItalianJamaicanJapaneseJordanianKenyanKiowaKoreanLaotianLatvianLebaneseLiberianLithuanianLumbeeLuxembourgerMacedonianMalaysianMalteseMarshalleseMenomineeMexicanMexican American IndianMongolianMoroccanNative HawaiianNavajoNepaleseNew ZealanderNicaraguanNigerianNorthern EuropeanNorwegianOkinawanOsageOttawaPaiutePakistaniPalestinianPanamanianParaguayanPennsylvania GermanPeruvianPimaPolishPortuguesePotawatomiPuebloPuerto RicanPuget Sound SalishRomanianRussianSalvadoranSamoanScandinavianScotch-IrishScottishSeminoleSenegaleseSerbianShoshoneSierra LeoneanSiouxSlavicSlovakSloveneSomaliSouth AfricanSouth AmericanSouth American IndianSoviet UnionSpaniardSpanishSpanish AmericanSpanish American IndianSri LankanSubsaharan AfricanSudaneseSwedishSwissSyrianTaiwaneseThaiTlingit-HaidaTohono O'OdhamTonganTrinidadian and TobagonianTsimshianTurkishU.S. Virgin IslanderUgandanUkrainianUruguayanUteVenezuelanVietnameseWelshWest IndianYakamaYaquiYugoslavianYumanYup'ikZimbabwean
Immigration
NonimmigrantsImmigrantsAfghanistanAfricaAlbaniaArgentinaArmeniaAsiaAustraliaAustriaBahamasBangladeshBarbadosBelarusBelgiumBelizeBoliviaBosnia and HerzegovinaBrazilBulgariaBurma/MyanmarCabo VerdeCambodiaCameroonCanadaCaribbeanCentral AmericaChileChinaColombiaCongoCosta RicaCroatiaCubaCzechoslovakiaDenmarkDominicaDominican RepublicEastern AfricaEastern AsiaEastern EuropeEcuadorEgyptEl SalvadorEnglandEritreaEthiopiaEuropeFijiFranceGermanyGhanaGreeceGrenadaGuatemalaGuyanaHaitiHondurasHong KongHungaryIndiaIndonesiaIranIraqIrelandIsraelItalyJamaicaJapanJordanKazakhstanKenyaKoreaKuwaitLaosLatin AmericaLatviaLebanonLiberiaLithuaniaMalaysiaMexicoMicronesiaMiddle AfricaMoldovaMoroccoNepalNetherlandsNicaraguaNigeriaNorth AmericaNorth MacedoniaNorthern AfricaNorthern EuropeNorwayOceaniaPakistanPanamaPeruPhilippinesPolandPortugalRomaniaRussiaSaudi ArabiaScotlandSenegalSerbiaSierra LeoneSingaporeSomaliaSouth AfricaSouth AmericaSouth Central AsiaSouth Eastern AsiaSouthern EuropeSpainSri LankaSt. Vincent and the GrenadinesSudanSwedenSwitzerlandSyriaTaiwanThailandTrinidad and TobagoTurkeyUgandaUkraineUruguayUzbekistanVenezuelaVietnamWest IndiesWestern AfricaWestern AsiaWestern EuropeYemenZaireZimbabweAzores
Median Family Income
Income
Poverty
Unemployment
Labor Participation
Family Structure
Vehicle Availability
Education Level
Disability

Median Family Income Comparison

Afghans

French

Exceptional
Average
$112,971
MEDIAN FAMILY INCOME
99.5/ 100
METRIC RATING
72nd/ 347
METRIC RANK
$102,368
MEDIAN FAMILY INCOME
46.1/ 100
METRIC RATING
176th/ 347
METRIC RANK

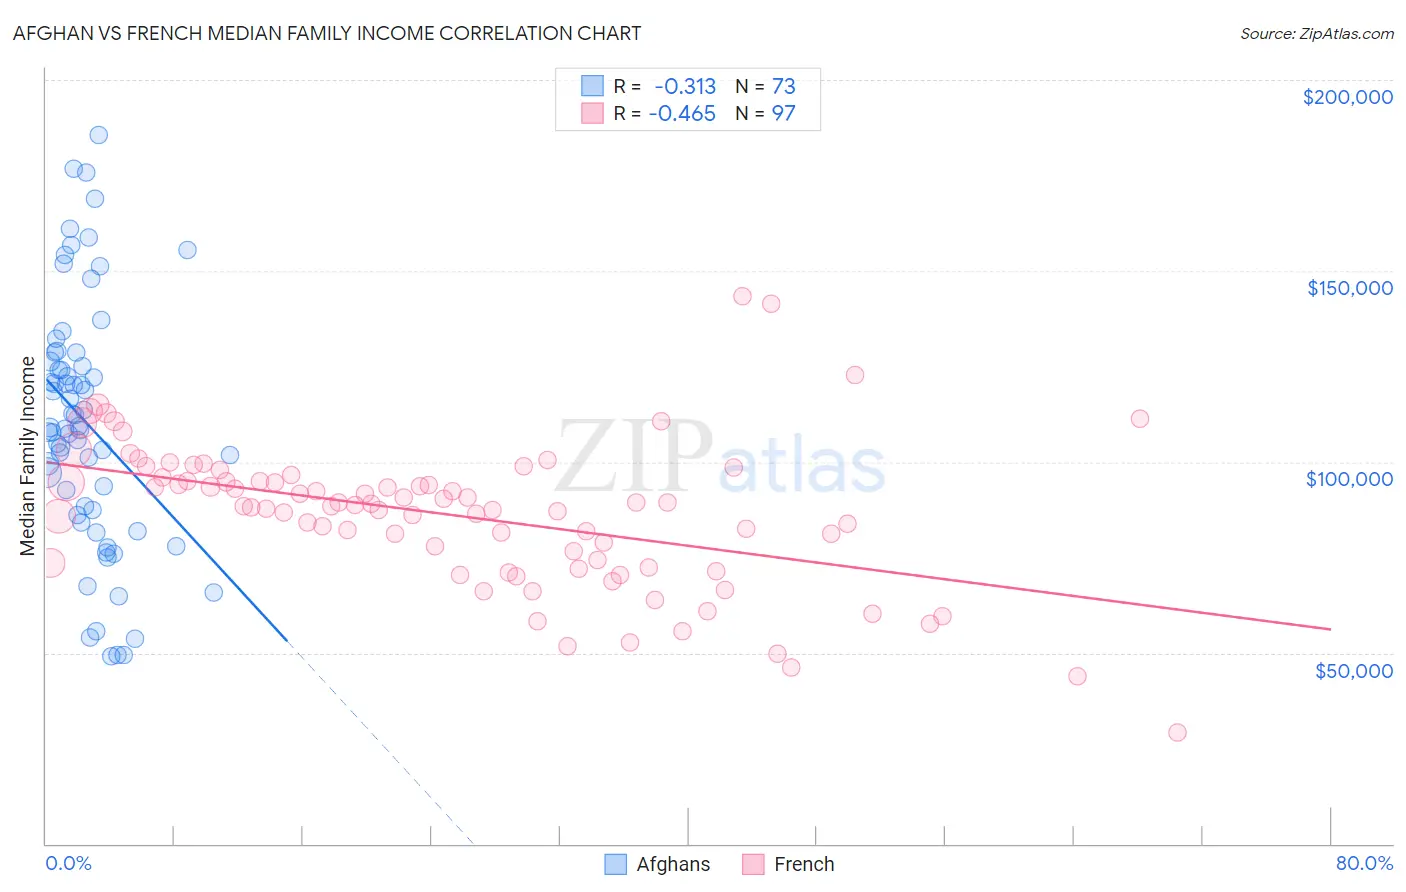
Afghan vs French Median Family Income Correlation Chart

The statistical analysis conducted on geographies consisting of 148,816,167 people shows a mild negative correlation between the proportion of Afghans and median family income in the United States with a correlation coefficient (R) of -0.313 and weighted average of $112,971. Similarly, the statistical analysis conducted on geographies consisting of 571,052,079 people shows a moderate negative correlation between the proportion of French and median family income in the United States with a correlation coefficient (R) of -0.465 and weighted average of $102,368, a difference of 10.4%.
Afghan vs French Median Family Income

Median Family Income Correlation Summary

MeasurementAfghanFrench
Minimum$49,167$29,018
Maximum$185,438$143,457
Range$136,271$114,439
Mean$110,128$85,989
Median$108,924$88,473
Interquartile 25% (IQ1)$86,729$72,966
Interquartile 75% (IQ3)$127,419$95,475
Interquartile Range (IQR)$40,689$22,509
Standard Deviation (Sample)$32,416$19,163
Standard Deviation (Population)$32,193$19,064

Similar Demographics by Median Family Income

Demographics Similar to Afghans by Median Family Income

In terms of median family income, the demographic groups most similar to Afghans are Laotian ($112,859, a difference of 0.10%), Immigrants from Italy ($112,848, a difference of 0.11%), South African ($113,229, a difference of 0.23%), Immigrants from Western Europe ($112,688, a difference of 0.25%), and Argentinean ($112,665, a difference of 0.27%).
DemographicsRating | RankMedian Family Income
Egyptians
99.7
/100
|
#65
Exceptional
$114,119
Paraguayans
99.7
/100
|
#66
Exceptional
$114,016
Immigrants | Spain
99.7
/100
|
#67
Exceptional
$113,815
Immigrants | Serbia
99.6
/100
|
#68
Exceptional
$113,463
Immigrants | Bulgaria
99.6
/100
|
#69
Exceptional
$113,461
Immigrants | Romania
99.6
/100
|
#70
Exceptional
$113,434
South Africans
99.5
/100
|
#71
Exceptional
$113,229
Afghans
99.5
/100
|
#72
Exceptional
$112,971
Laotians
99.5
/100
|
#73
Exceptional
$112,859
Immigrants | Italy
99.4
/100
|
#74
Exceptional
$112,848
Immigrants | Western Europe
99.4
/100
|
#75
Exceptional
$112,688
Argentineans
99.4
/100
|
#76
Exceptional
$112,665
Immigrants | Eastern Europe
99.4
/100
|
#77
Exceptional
$112,527
Immigrants | Canada
99.3
/100
|
#78
Exceptional
$112,374
Italians
99.3
/100
|
#79
Exceptional
$112,372

Demographics Similar to French by Median Family Income

In terms of median family income, the demographic groups most similar to French are Immigrants from Eastern Africa ($102,451, a difference of 0.080%), German ($102,254, a difference of 0.11%), Welsh ($102,151, a difference of 0.21%), Finnish ($102,676, a difference of 0.30%), and Belgian ($102,788, a difference of 0.41%).
DemographicsRating | RankMedian Family Income
Czechoslovakians
57.6
/100
|
#169
Average
$103,273
Immigrants | Uzbekistan
56.6
/100
|
#170
Average
$103,197
Alsatians
54.3
/100
|
#171
Average
$103,010
Immigrants | Eritrea
51.9
/100
|
#172
Average
$102,823
Belgians
51.4
/100
|
#173
Average
$102,788
Finns
50.0
/100
|
#174
Average
$102,676
Immigrants | Eastern Africa
47.1
/100
|
#175
Average
$102,451
French
46.1
/100
|
#176
Average
$102,368
Germans
44.6
/100
|
#177
Average
$102,254
Welsh
43.3
/100
|
#178
Average
$102,151
South Americans
39.7
/100
|
#179
Fair
$101,856
French Canadians
37.0
/100
|
#180
Fair
$101,634
Spaniards
36.8
/100
|
#181
Fair
$101,617
Tsimshian
35.9
/100
|
#182
Fair
$101,543
Kenyans
34.5
/100
|
#183
Fair
$101,417