Afghan vs Immigrants from Ukraine Median Family Income
COMPARE
Afghan
Immigrants from Ukraine
Median Family Income
Median Family Income Comparison
Afghans
Immigrants from Ukraine
$112,971
MEDIAN FAMILY INCOME
99.5/ 100
METRIC RATING
72nd/ 347
METRIC RANK
$109,645
MEDIAN FAMILY INCOME
97.2/ 100
METRIC RATING
101st/ 347
METRIC RANK
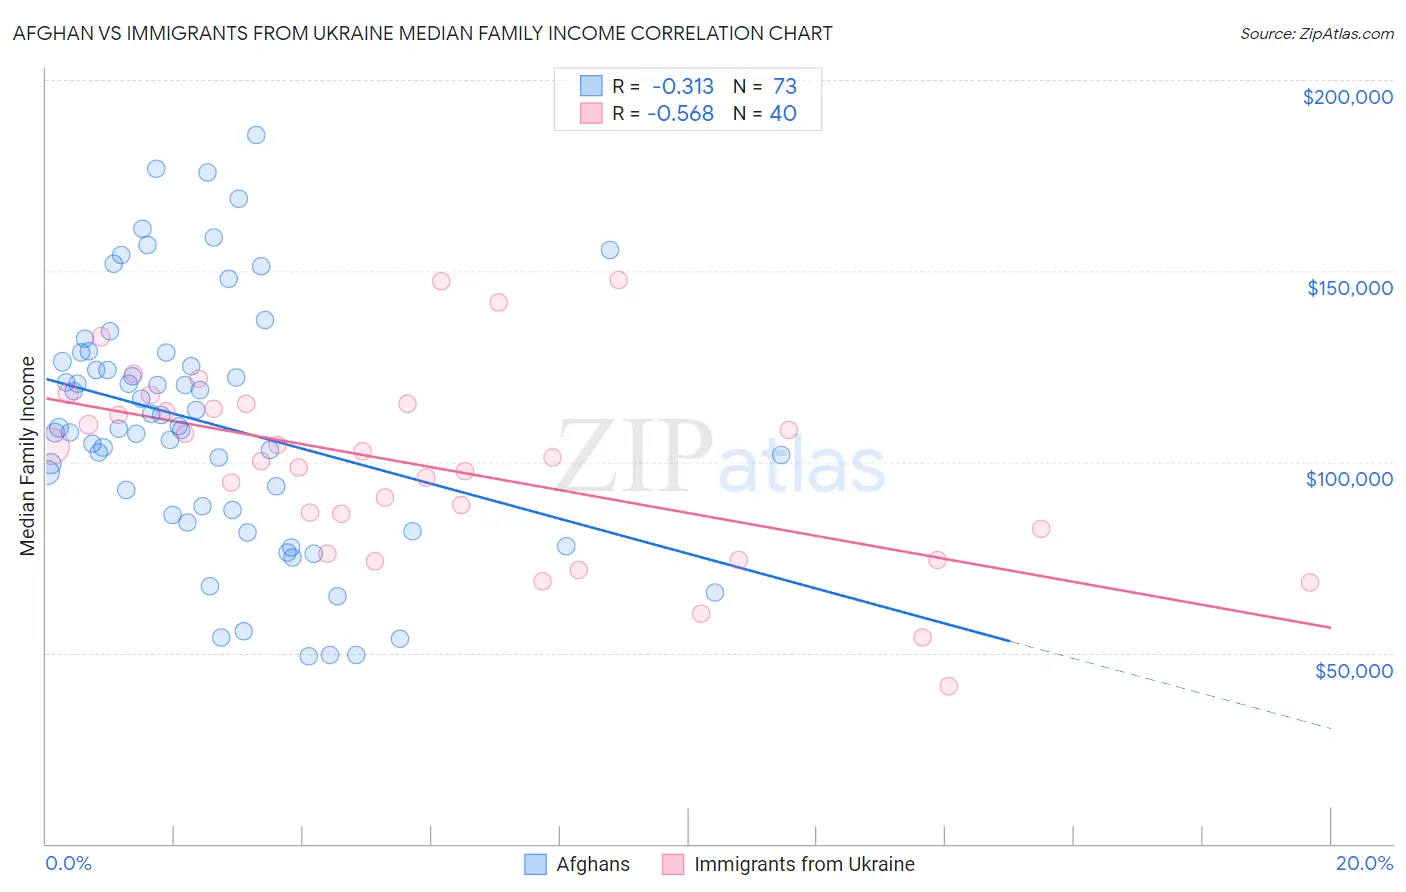
Afghan vs Immigrants from Ukraine Median Family Income Correlation Chart
The statistical analysis conducted on geographies consisting of 148,816,167 people shows a mild negative correlation between the proportion of Afghans and median family income in the United States with a correlation coefficient (R) of -0.313 and weighted average of $112,971. Similarly, the statistical analysis conducted on geographies consisting of 289,573,478 people shows a substantial negative correlation between the proportion of Immigrants from Ukraine and median family income in the United States with a correlation coefficient (R) of -0.568 and weighted average of $109,645, a difference of 3.0%.
Median Family Income Correlation Summary
| Measurement | Afghan | Immigrants from Ukraine |
| Minimum | $49,167 | $41,250 |
| Maximum | $185,438 | $147,711 |
| Range | $136,271 | $106,461 |
| Mean | $110,128 | $98,572 |
| Median | $108,924 | $100,738 |
| Interquartile 25% (IQ1) | $86,729 | $79,127 |
| Interquartile 75% (IQ3) | $127,419 | $114,676 |
| Interquartile Range (IQR) | $40,689 | $35,549 |
| Standard Deviation (Sample) | $32,416 | $24,600 |
| Standard Deviation (Population) | $32,193 | $24,291 |
Similar Demographics by Median Family Income
Demographics Similar to Afghans by Median Family Income
In terms of median family income, the demographic groups most similar to Afghans are Laotian ($112,859, a difference of 0.10%), Immigrants from Italy ($112,848, a difference of 0.11%), South African ($113,229, a difference of 0.23%), Immigrants from Western Europe ($112,688, a difference of 0.25%), and Argentinean ($112,665, a difference of 0.27%).
| Demographics | Rating | Rank | Median Family Income |
| Egyptians | 99.7 /100 | #65 | Exceptional $114,119 |
| Paraguayans | 99.7 /100 | #66 | Exceptional $114,016 |
| Immigrants | Spain | 99.7 /100 | #67 | Exceptional $113,815 |
| Immigrants | Serbia | 99.6 /100 | #68 | Exceptional $113,463 |
| Immigrants | Bulgaria | 99.6 /100 | #69 | Exceptional $113,461 |
| Immigrants | Romania | 99.6 /100 | #70 | Exceptional $113,434 |
| South Africans | 99.5 /100 | #71 | Exceptional $113,229 |
| Afghans | 99.5 /100 | #72 | Exceptional $112,971 |
| Laotians | 99.5 /100 | #73 | Exceptional $112,859 |
| Immigrants | Italy | 99.4 /100 | #74 | Exceptional $112,848 |
| Immigrants | Western Europe | 99.4 /100 | #75 | Exceptional $112,688 |
| Argentineans | 99.4 /100 | #76 | Exceptional $112,665 |
| Immigrants | Eastern Europe | 99.4 /100 | #77 | Exceptional $112,527 |
| Immigrants | Canada | 99.3 /100 | #78 | Exceptional $112,374 |
| Italians | 99.3 /100 | #79 | Exceptional $112,372 |
Demographics Similar to Immigrants from Ukraine by Median Family Income
In terms of median family income, the demographic groups most similar to Immigrants from Ukraine are Macedonian ($109,668, a difference of 0.020%), Assyrian/Chaldean/Syriac ($109,622, a difference of 0.020%), Armenian ($109,692, a difference of 0.040%), Immigrants from Kuwait ($109,731, a difference of 0.080%), and Jordanian ($109,865, a difference of 0.20%).
| Demographics | Rating | Rank | Median Family Income |
| Koreans | 97.8 /100 | #94 | Exceptional $110,103 |
| Zimbabweans | 97.7 /100 | #95 | Exceptional $110,011 |
| Immigrants | Moldova | 97.7 /100 | #96 | Exceptional $109,975 |
| Jordanians | 97.5 /100 | #97 | Exceptional $109,865 |
| Immigrants | Kuwait | 97.4 /100 | #98 | Exceptional $109,731 |
| Armenians | 97.3 /100 | #99 | Exceptional $109,692 |
| Macedonians | 97.3 /100 | #100 | Exceptional $109,668 |
| Immigrants | Ukraine | 97.2 /100 | #101 | Exceptional $109,645 |
| Assyrians/Chaldeans/Syriacs | 97.2 /100 | #102 | Exceptional $109,622 |
| Immigrants | Brazil | 96.9 /100 | #103 | Exceptional $109,418 |
| Palestinians | 96.9 /100 | #104 | Exceptional $109,413 |
| Syrians | 96.7 /100 | #105 | Exceptional $109,299 |
| Albanians | 96.4 /100 | #106 | Exceptional $109,136 |
| Immigrants | North Macedonia | 96.4 /100 | #107 | Exceptional $109,136 |
| Immigrants | Zimbabwe | 95.9 /100 | #108 | Exceptional $108,830 |