Afghan vs Immigrants from Oceania Cognitive Disability
COMPARE
Afghan
Immigrants from Oceania
Cognitive Disability
Cognitive Disability Comparison
Afghans
Immigrants from Oceania
17.3%
COGNITIVE DISABILITY
38.2/ 100
METRIC RATING
185th/ 347
METRIC RANK
17.6%
COGNITIVE DISABILITY
7.3/ 100
METRIC RATING
212th/ 347
METRIC RANK
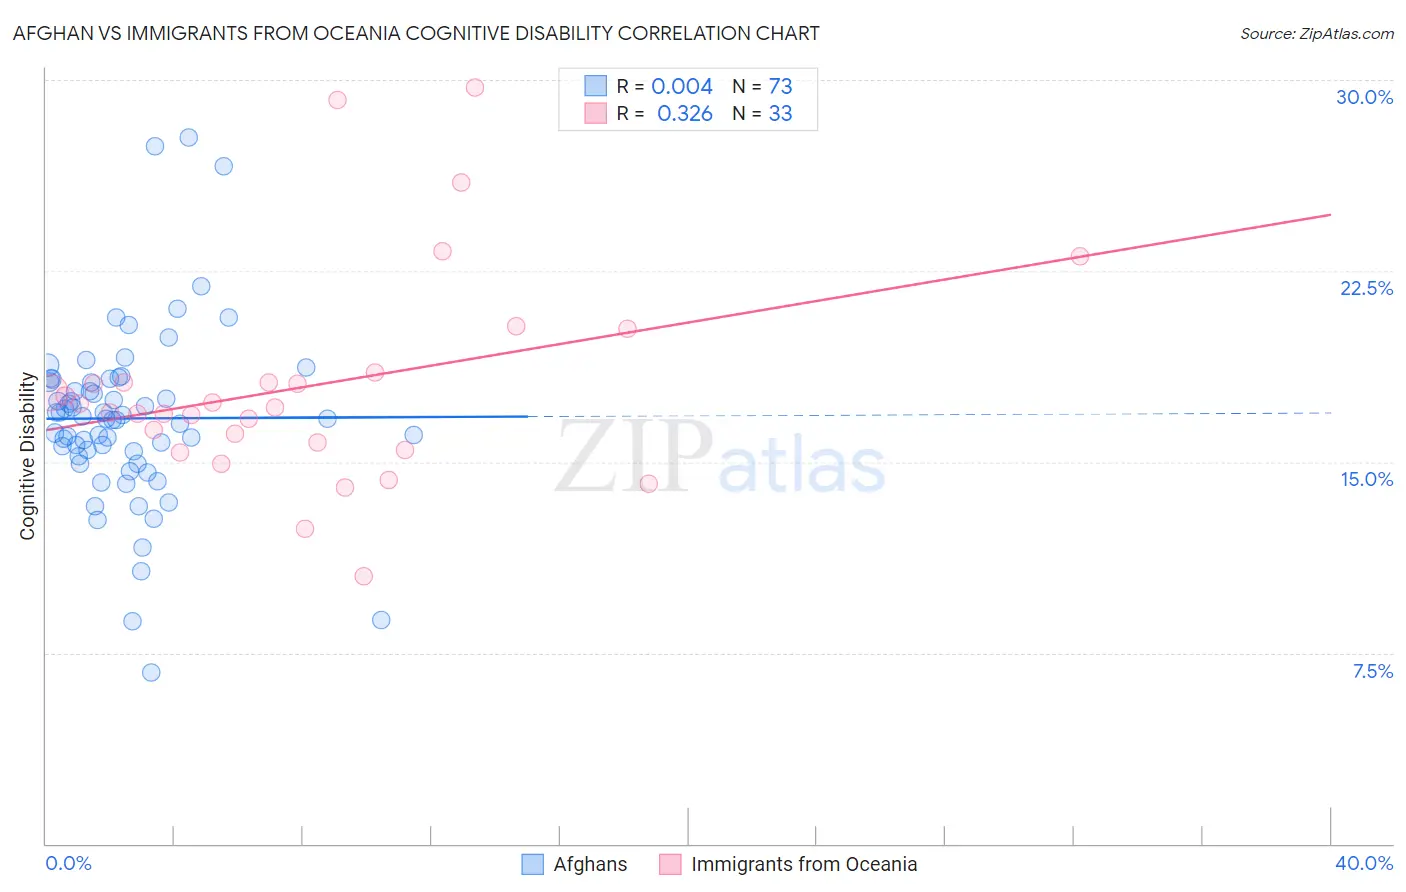
Afghan vs Immigrants from Oceania Cognitive Disability Correlation Chart
The statistical analysis conducted on geographies consisting of 148,870,382 people shows no correlation between the proportion of Afghans and percentage of population with cognitive disability in the United States with a correlation coefficient (R) of 0.004 and weighted average of 17.3%. Similarly, the statistical analysis conducted on geographies consisting of 305,496,536 people shows a mild positive correlation between the proportion of Immigrants from Oceania and percentage of population with cognitive disability in the United States with a correlation coefficient (R) of 0.326 and weighted average of 17.6%, a difference of 1.5%.
Cognitive Disability Correlation Summary
| Measurement | Afghan | Immigrants from Oceania |
| Minimum | 6.7% | 10.5% |
| Maximum | 27.8% | 29.7% |
| Range | 21.0% | 19.2% |
| Mean | 16.7% | 18.0% |
| Median | 16.7% | 17.1% |
| Interquartile 25% (IQ1) | 15.3% | 15.6% |
| Interquartile 75% (IQ3) | 18.2% | 18.3% |
| Interquartile Range (IQR) | 2.9% | 2.7% |
| Standard Deviation (Sample) | 3.5% | 4.2% |
| Standard Deviation (Population) | 3.5% | 4.1% |
Similar Demographics by Cognitive Disability
Demographics Similar to Afghans by Cognitive Disability
In terms of cognitive disability, the demographic groups most similar to Afghans are Crow (17.3%, a difference of 0.030%), Spaniard (17.3%, a difference of 0.060%), Cambodian (17.3%, a difference of 0.070%), Immigrants from Guyana (17.3%, a difference of 0.14%), and Arab (17.3%, a difference of 0.14%).
| Demographics | Rating | Rank | Cognitive Disability |
| Spanish | 48.9 /100 | #178 | Average 17.3% |
| Sioux | 48.6 /100 | #179 | Average 17.3% |
| Pakistanis | 43.9 /100 | #180 | Average 17.3% |
| Immigrants | Guyana | 42.9 /100 | #181 | Average 17.3% |
| Arabs | 42.8 /100 | #182 | Average 17.3% |
| Spaniards | 40.3 /100 | #183 | Average 17.3% |
| Crow | 39.1 /100 | #184 | Fair 17.3% |
| Afghans | 38.2 /100 | #185 | Fair 17.3% |
| Cambodians | 35.9 /100 | #186 | Fair 17.3% |
| Immigrants | Fiji | 33.7 /100 | #187 | Fair 17.4% |
| Immigrants | France | 29.8 /100 | #188 | Fair 17.4% |
| Immigrants | Western Asia | 29.5 /100 | #189 | Fair 17.4% |
| Immigrants | Spain | 27.7 /100 | #190 | Fair 17.4% |
| Immigrants | Nonimmigrants | 27.4 /100 | #191 | Fair 17.4% |
| Immigrants | Haiti | 27.1 /100 | #192 | Fair 17.4% |
Demographics Similar to Immigrants from Oceania by Cognitive Disability
In terms of cognitive disability, the demographic groups most similar to Immigrants from Oceania are Hawaiian (17.6%, a difference of 0.010%), Taiwanese (17.6%, a difference of 0.040%), Immigrants from El Salvador (17.6%, a difference of 0.040%), Alaskan Athabascan (17.6%, a difference of 0.050%), and Okinawan (17.6%, a difference of 0.050%).
| Demographics | Rating | Rank | Cognitive Disability |
| Puget Sound Salish | 10.9 /100 | #205 | Poor 17.5% |
| Alaska Natives | 10.4 /100 | #206 | Poor 17.5% |
| Immigrants | Latin America | 9.7 /100 | #207 | Tragic 17.6% |
| Immigrants | Cameroon | 9.3 /100 | #208 | Tragic 17.6% |
| Immigrants | Trinidad and Tobago | 8.7 /100 | #209 | Tragic 17.6% |
| Immigrants | Jamaica | 8.5 /100 | #210 | Tragic 17.6% |
| Taiwanese | 7.7 /100 | #211 | Tragic 17.6% |
| Immigrants | Oceania | 7.3 /100 | #212 | Tragic 17.6% |
| Hawaiians | 7.2 /100 | #213 | Tragic 17.6% |
| Immigrants | El Salvador | 7.0 /100 | #214 | Tragic 17.6% |
| Alaskan Athabascans | 6.9 /100 | #215 | Tragic 17.6% |
| Okinawans | 6.8 /100 | #216 | Tragic 17.6% |
| Salvadorans | 6.7 /100 | #217 | Tragic 17.6% |
| Icelanders | 6.4 /100 | #218 | Tragic 17.6% |
| Immigrants | Sierra Leone | 6.3 /100 | #219 | Tragic 17.6% |