Immigrants from Burma/Myanmar vs Immigrants from Oceania Median Family Income
COMPARE
Immigrants from Burma/Myanmar
Immigrants from Oceania
Median Family Income
Median Family Income Comparison
Immigrants from Burma/Myanmar
Immigrants from Oceania
$94,472
MEDIAN FAMILY INCOME
1.5/ 100
METRIC RATING
235th/ 347
METRIC RANK
$106,453
MEDIAN FAMILY INCOME
87.3/ 100
METRIC RATING
134th/ 347
METRIC RANK
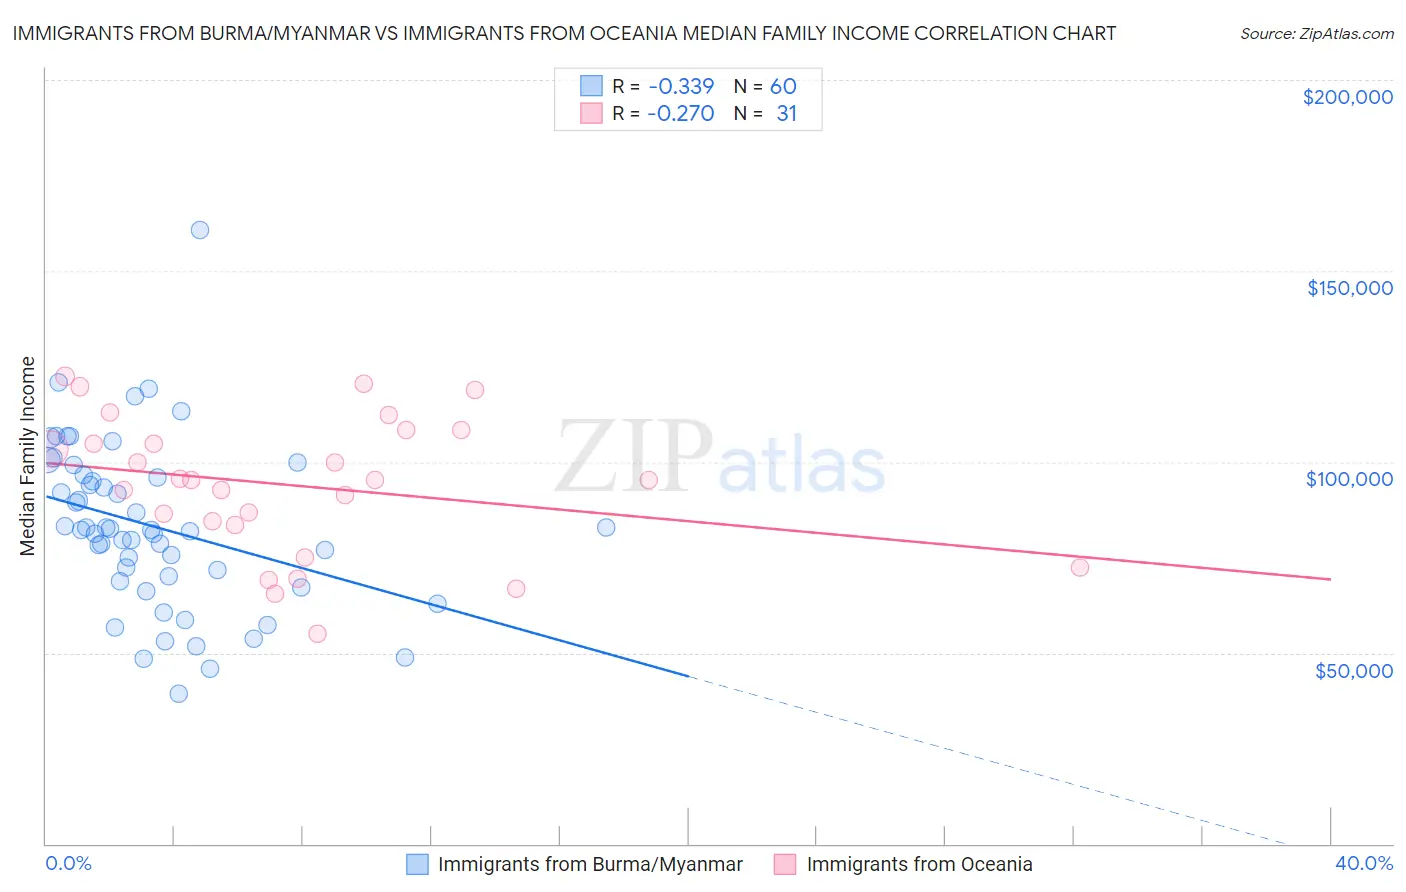
Immigrants from Burma/Myanmar vs Immigrants from Oceania Median Family Income Correlation Chart
The statistical analysis conducted on geographies consisting of 172,231,822 people shows a mild negative correlation between the proportion of Immigrants from Burma/Myanmar and median family income in the United States with a correlation coefficient (R) of -0.339 and weighted average of $94,472. Similarly, the statistical analysis conducted on geographies consisting of 305,332,408 people shows a weak negative correlation between the proportion of Immigrants from Oceania and median family income in the United States with a correlation coefficient (R) of -0.270 and weighted average of $106,453, a difference of 12.7%.
Median Family Income Correlation Summary
| Measurement | Immigrants from Burma/Myanmar | Immigrants from Oceania |
| Minimum | $39,136 | $55,035 |
| Maximum | $160,863 | $122,501 |
| Range | $121,727 | $67,465 |
| Mean | $83,083 | $93,799 |
| Median | $82,122 | $95,302 |
| Interquartile 25% (IQ1) | $69,331 | $83,518 |
| Interquartile 75% (IQ3) | $96,286 | $108,312 |
| Interquartile Range (IQR) | $26,955 | $24,794 |
| Standard Deviation (Sample) | $21,974 | $17,988 |
| Standard Deviation (Population) | $21,790 | $17,696 |
Similar Demographics by Median Family Income
Demographics Similar to Immigrants from Burma/Myanmar by Median Family Income
In terms of median family income, the demographic groups most similar to Immigrants from Burma/Myanmar are Trinidadian and Tobagonian ($94,466, a difference of 0.010%), Alaskan Athabascan ($94,429, a difference of 0.040%), Immigrants from Western Africa ($94,638, a difference of 0.18%), Immigrants from Bangladesh ($94,665, a difference of 0.20%), and Nepalese ($94,153, a difference of 0.34%).
| Demographics | Rating | Rank | Median Family Income |
| Immigrants | Azores | 2.4 /100 | #228 | Tragic $95,402 |
| Marshallese | 2.2 /100 | #229 | Tragic $95,293 |
| Malaysians | 2.2 /100 | #230 | Tragic $95,230 |
| Ecuadorians | 2.1 /100 | #231 | Tragic $95,114 |
| Immigrants | Venezuela | 1.9 /100 | #232 | Tragic $94,904 |
| Immigrants | Bangladesh | 1.6 /100 | #233 | Tragic $94,665 |
| Immigrants | Western Africa | 1.6 /100 | #234 | Tragic $94,638 |
| Immigrants | Burma/Myanmar | 1.5 /100 | #235 | Tragic $94,472 |
| Trinidadians and Tobagonians | 1.5 /100 | #236 | Tragic $94,466 |
| Alaskan Athabascans | 1.5 /100 | #237 | Tragic $94,429 |
| Nepalese | 1.3 /100 | #238 | Tragic $94,153 |
| Salvadorans | 1.2 /100 | #239 | Tragic $94,109 |
| Somalis | 1.2 /100 | #240 | Tragic $94,085 |
| Immigrants | Trinidad and Tobago | 1.2 /100 | #241 | Tragic $93,988 |
| Barbadians | 1.1 /100 | #242 | Tragic $93,919 |
Demographics Similar to Immigrants from Oceania by Median Family Income
In terms of median family income, the demographic groups most similar to Immigrants from Oceania are Ugandan ($106,541, a difference of 0.080%), Immigrants from Fiji ($106,544, a difference of 0.090%), Canadian ($106,597, a difference of 0.14%), Portuguese ($106,286, a difference of 0.16%), and Immigrants from South Eastern Asia ($106,252, a difference of 0.19%).
| Demographics | Rating | Rank | Median Family Income |
| Lebanese | 90.5 /100 | #127 | Exceptional $107,086 |
| Immigrants | Ethiopia | 90.0 /100 | #128 | Excellent $106,969 |
| Arabs | 89.9 /100 | #129 | Excellent $106,952 |
| Brazilians | 89.8 /100 | #130 | Excellent $106,942 |
| Canadians | 88.1 /100 | #131 | Excellent $106,597 |
| Immigrants | Fiji | 87.8 /100 | #132 | Excellent $106,544 |
| Ugandans | 87.8 /100 | #133 | Excellent $106,541 |
| Immigrants | Oceania | 87.3 /100 | #134 | Excellent $106,453 |
| Portuguese | 86.3 /100 | #135 | Excellent $106,286 |
| Immigrants | South Eastern Asia | 86.1 /100 | #136 | Excellent $106,252 |
| Immigrants | Uganda | 85.7 /100 | #137 | Excellent $106,188 |
| Immigrants | Vietnam | 85.7 /100 | #138 | Excellent $106,186 |
| Luxembourgers | 85.7 /100 | #139 | Excellent $106,183 |
| Norwegians | 85.5 /100 | #140 | Excellent $106,144 |
| Immigrants | Syria | 85.3 /100 | #141 | Excellent $106,118 |