Afghan vs Polish Median Family Income

COMPARE

Afghan
Race
Ancestry
AfghanAfricanAlaska NativeAlaskan AthabascanAlbanianAleutAlsatianAmericanApacheArabArapahoArgentineanArmenianAssyrian/Chaldean/SyriacAustralianAustrianBahamianBangladeshiBarbadianBasqueBelgianBelizeanBermudanBhutaneseBlackfeetBolivianBrazilianBritishBritish West IndianBulgarianBurmeseCajunCambodianCanadianCape VerdeanCarpatho RusynCelticCentral AmericanCentral American IndianCherokeeCheyenneChickasawChileanChineseChippewaChoctawColombianColvilleComancheCosta RicanCreeCreekCroatianCrowCubanCypriotCzechCzechoslovakianDanishDelawareDominicanDutchDutch West IndianEastern EuropeanEcuadorianEgyptianEnglishEstonianEthiopianEuropeanFijianFilipinoFinnishFrenchFrench American IndianFrench CanadianGermanGerman RussianGhanaianGreekGuamanian/ChamorroGuatemalanGuyaneseHaitianHmongHonduranHopiHoumaHungarianIcelanderIndian (Asian)IndonesianInupiatIranianIraqiIrishIroquoisIsraeliItalianJamaicanJapaneseJordanianKenyanKiowaKoreanLaotianLatvianLebaneseLiberianLithuanianLumbeeLuxembourgerMacedonianMalaysianMalteseMarshalleseMenomineeMexicanMexican American IndianMongolianMoroccanNative HawaiianNavajoNepaleseNew ZealanderNicaraguanNigerianNorthern EuropeanNorwegianOkinawanOsageOttawaPaiutePakistaniPalestinianPanamanianParaguayanPennsylvania GermanPeruvianPimaPortuguesePotawatomiPuebloPuerto RicanPuget Sound SalishRomanianRussianSalvadoranSamoanScandinavianScotch-IrishScottishSeminoleSenegaleseSerbianShoshoneSierra LeoneanSiouxSlavicSlovakSloveneSomaliSouth AfricanSouth AmericanSouth American IndianSoviet UnionSpaniardSpanishSpanish AmericanSpanish American IndianSri LankanSubsaharan AfricanSudaneseSwedishSwissSyrianTaiwaneseThaiTlingit-HaidaTohono O'OdhamTonganTrinidadian and TobagonianTsimshianTurkishU.S. Virgin IslanderUgandanUkrainianUruguayanUteVenezuelanVietnameseWelshWest IndianYakamaYaquiYugoslavianYumanYup'ikZimbabwean
Immigration
NonimmigrantsImmigrantsAfghanistanAfricaAlbaniaArgentinaArmeniaAsiaAustraliaAustriaBahamasBangladeshBarbadosBelarusBelgiumBelizeBoliviaBosnia and HerzegovinaBrazilBulgariaBurma/MyanmarCabo VerdeCambodiaCameroonCanadaCaribbeanCentral AmericaChileChinaColombiaCongoCosta RicaCroatiaCubaCzechoslovakiaDenmarkDominicaDominican RepublicEastern AfricaEastern AsiaEastern EuropeEcuadorEgyptEl SalvadorEnglandEritreaEthiopiaEuropeFijiFranceGermanyGhanaGreeceGrenadaGuatemalaGuyanaHaitiHondurasHong KongHungaryIndiaIndonesiaIranIraqIrelandIsraelItalyJamaicaJapanJordanKazakhstanKenyaKoreaKuwaitLaosLatin AmericaLatviaLebanonLiberiaLithuaniaMalaysiaMexicoMicronesiaMiddle AfricaMoldovaMoroccoNepalNetherlandsNicaraguaNigeriaNorth AmericaNorth MacedoniaNorthern AfricaNorthern EuropeNorwayOceaniaPakistanPanamaPeruPhilippinesPolandPortugalRomaniaRussiaSaudi ArabiaScotlandSenegalSerbiaSierra LeoneSingaporeSomaliaSouth AfricaSouth AmericaSouth Central AsiaSouth Eastern AsiaSouthern EuropeSpainSri LankaSt. Vincent and the GrenadinesSudanSwedenSwitzerlandSyriaTaiwanThailandTrinidad and TobagoTurkeyUgandaUkraineUruguayUzbekistanVenezuelaVietnamWest IndiesWestern AfricaWestern AsiaWestern EuropeYemenZaireZimbabweAzores
Polish
Race
Ancestry
AfricanAlaska NativeAlaskan AthabascanAlbanianAleutAlsatianAmericanApacheArabArapahoArgentineanArmenianAssyrian/Chaldean/SyriacAustralianAustrianBahamianBangladeshiBarbadianBasqueBelgianBelizeanBermudanBhutaneseBlackfeetBolivianBrazilianBritishBritish West IndianBulgarianBurmeseCajunCambodianCanadianCape VerdeanCarpatho RusynCelticCentral AmericanCentral American IndianCherokeeCheyenneChickasawChileanChineseChippewaChoctawColombianColvilleComancheCosta RicanCreeCreekCroatianCrowCubanCypriotCzechCzechoslovakianDanishDelawareDominicanDutchDutch West IndianEastern EuropeanEcuadorianEgyptianEnglishEstonianEthiopianEuropeanFijianFilipinoFinnishFrenchFrench American IndianFrench CanadianGermanGerman RussianGhanaianGreekGuamanian/ChamorroGuatemalanGuyaneseHaitianHmongHonduranHopiHoumaHungarianIcelanderIndian (Asian)IndonesianInupiatIranianIraqiIrishIroquoisIsraeliItalianJamaicanJapaneseJordanianKenyanKiowaKoreanLaotianLatvianLebaneseLiberianLithuanianLumbeeLuxembourgerMacedonianMalaysianMalteseMarshalleseMenomineeMexicanMexican American IndianMongolianMoroccanNative HawaiianNavajoNepaleseNew ZealanderNicaraguanNigerianNorthern EuropeanNorwegianOkinawanOsageOttawaPaiutePakistaniPalestinianPanamanianParaguayanPennsylvania GermanPeruvianPimaPolishPortuguesePotawatomiPuebloPuerto RicanPuget Sound SalishRomanianRussianSalvadoranSamoanScandinavianScotch-IrishScottishSeminoleSenegaleseSerbianShoshoneSierra LeoneanSiouxSlavicSlovakSloveneSomaliSouth AfricanSouth AmericanSouth American IndianSoviet UnionSpaniardSpanishSpanish AmericanSpanish American IndianSri LankanSubsaharan AfricanSudaneseSwedishSwissSyrianTaiwaneseThaiTlingit-HaidaTohono O'OdhamTonganTrinidadian and TobagonianTsimshianTurkishU.S. Virgin IslanderUgandanUkrainianUruguayanUteVenezuelanVietnameseWelshWest IndianYakamaYaquiYugoslavianYumanYup'ikZimbabwean
Immigration
NonimmigrantsImmigrantsAfghanistanAfricaAlbaniaArgentinaArmeniaAsiaAustraliaAustriaBahamasBangladeshBarbadosBelarusBelgiumBelizeBoliviaBosnia and HerzegovinaBrazilBulgariaBurma/MyanmarCabo VerdeCambodiaCameroonCanadaCaribbeanCentral AmericaChileChinaColombiaCongoCosta RicaCroatiaCubaCzechoslovakiaDenmarkDominicaDominican RepublicEastern AfricaEastern AsiaEastern EuropeEcuadorEgyptEl SalvadorEnglandEritreaEthiopiaEuropeFijiFranceGermanyGhanaGreeceGrenadaGuatemalaGuyanaHaitiHondurasHong KongHungaryIndiaIndonesiaIranIraqIrelandIsraelItalyJamaicaJapanJordanKazakhstanKenyaKoreaKuwaitLaosLatin AmericaLatviaLebanonLiberiaLithuaniaMalaysiaMexicoMicronesiaMiddle AfricaMoldovaMoroccoNepalNetherlandsNicaraguaNigeriaNorth AmericaNorth MacedoniaNorthern AfricaNorthern EuropeNorwayOceaniaPakistanPanamaPeruPhilippinesPolandPortugalRomaniaRussiaSaudi ArabiaScotlandSenegalSerbiaSierra LeoneSingaporeSomaliaSouth AfricaSouth AmericaSouth Central AsiaSouth Eastern AsiaSouthern EuropeSpainSri LankaSt. Vincent and the GrenadinesSudanSwedenSwitzerlandSyriaTaiwanThailandTrinidad and TobagoTurkeyUgandaUkraineUruguayUzbekistanVenezuelaVietnamWest IndiesWestern AfricaWestern AsiaWestern EuropeYemenZaireZimbabweAzores
Median Family Income
Income
Poverty
Unemployment
Labor Participation
Family Structure
Vehicle Availability
Education Level
Disability

Median Family Income Comparison

Afghans

Poles

Exceptional
Exceptional
$112,971
MEDIAN FAMILY INCOME
99.5/ 100
METRIC RATING
72nd/ 347
METRIC RANK
$108,507
MEDIAN FAMILY INCOME
95.2/ 100
METRIC RATING
114th/ 347
METRIC RANK

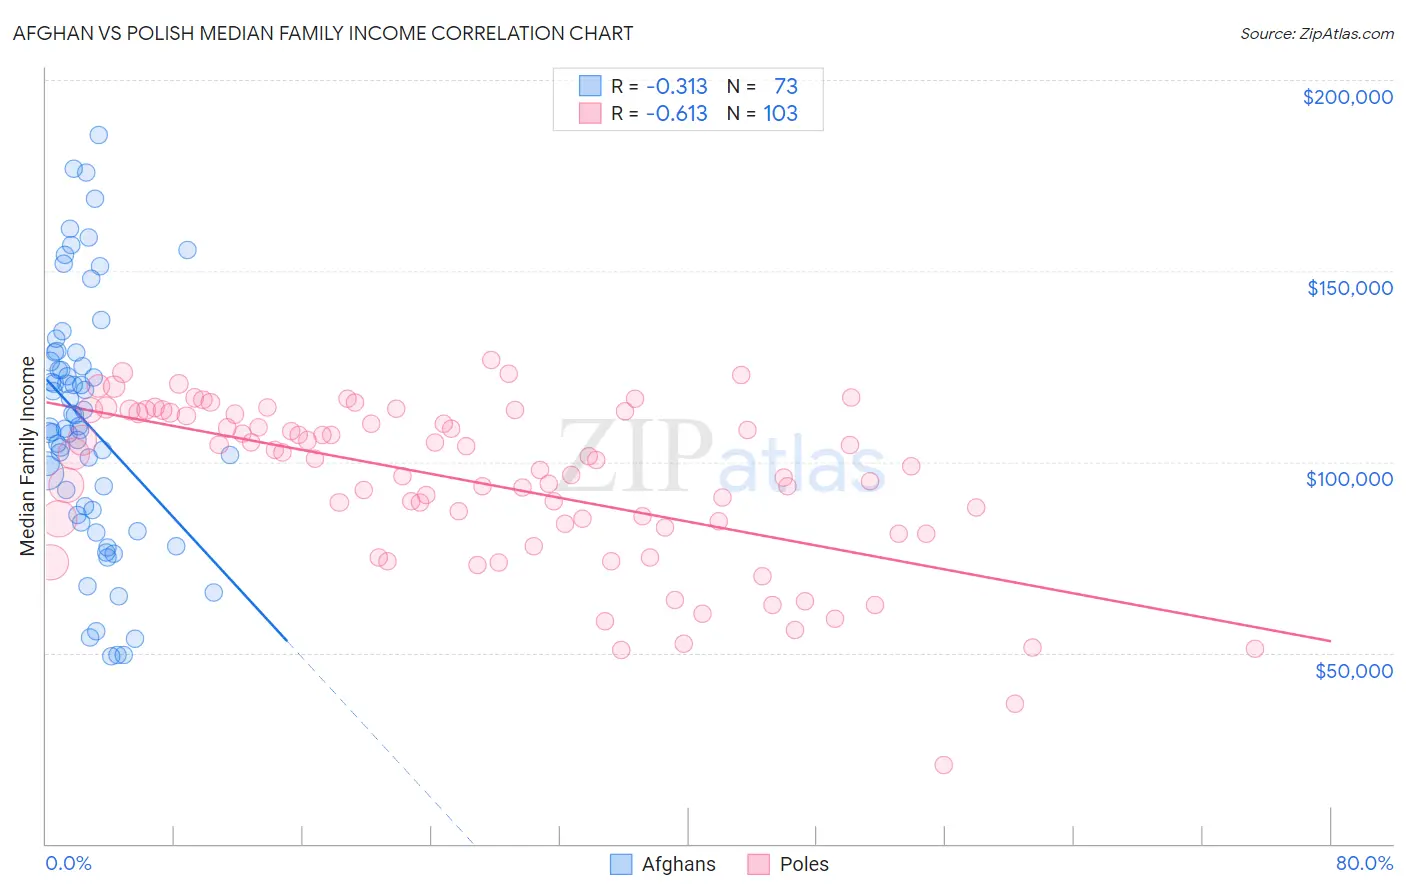
Afghan vs Polish Median Family Income Correlation Chart

The statistical analysis conducted on geographies consisting of 148,816,167 people shows a mild negative correlation between the proportion of Afghans and median family income in the United States with a correlation coefficient (R) of -0.313 and weighted average of $112,971. Similarly, the statistical analysis conducted on geographies consisting of 559,354,572 people shows a significant negative correlation between the proportion of Poles and median family income in the United States with a correlation coefficient (R) of -0.613 and weighted average of $108,507, a difference of 4.1%.
Afghan vs Polish Median Family Income

Median Family Income Correlation Summary

MeasurementAfghanPolish
Minimum$49,167$20,484
Maximum$185,438$126,779
Range$136,271$106,295
Mean$110,128$94,533
Median$108,924$100,344
Interquartile 25% (IQ1)$86,729$82,684
Interquartile 75% (IQ3)$127,419$112,830
Interquartile Range (IQR)$40,689$30,146
Standard Deviation (Sample)$32,416$21,570
Standard Deviation (Population)$32,193$21,465

Similar Demographics by Median Family Income

Demographics Similar to Afghans by Median Family Income

In terms of median family income, the demographic groups most similar to Afghans are Laotian ($112,859, a difference of 0.10%), Immigrants from Italy ($112,848, a difference of 0.11%), South African ($113,229, a difference of 0.23%), Immigrants from Western Europe ($112,688, a difference of 0.25%), and Argentinean ($112,665, a difference of 0.27%).
DemographicsRating | RankMedian Family Income
Egyptians
99.7
/100
|
#65
Exceptional
$114,119
Paraguayans
99.7
/100
|
#66
Exceptional
$114,016
Immigrants | Spain
99.7
/100
|
#67
Exceptional
$113,815
Immigrants | Serbia
99.6
/100
|
#68
Exceptional
$113,463
Immigrants | Bulgaria
99.6
/100
|
#69
Exceptional
$113,461
Immigrants | Romania
99.6
/100
|
#70
Exceptional
$113,434
South Africans
99.5
/100
|
#71
Exceptional
$113,229
Afghans
99.5
/100
|
#72
Exceptional
$112,971
Laotians
99.5
/100
|
#73
Exceptional
$112,859
Immigrants | Italy
99.4
/100
|
#74
Exceptional
$112,848
Immigrants | Western Europe
99.4
/100
|
#75
Exceptional
$112,688
Argentineans
99.4
/100
|
#76
Exceptional
$112,665
Immigrants | Eastern Europe
99.4
/100
|
#77
Exceptional
$112,527
Immigrants | Canada
99.3
/100
|
#78
Exceptional
$112,374
Italians
99.3
/100
|
#79
Exceptional
$112,372

Demographics Similar to Poles by Median Family Income

In terms of median family income, the demographic groups most similar to Poles are Swedish ($108,499, a difference of 0.010%), Immigrants from Saudi Arabia ($108,544, a difference of 0.030%), Immigrants from Poland ($108,570, a difference of 0.060%), Chilean ($108,429, a difference of 0.070%), and Immigrants from Western Asia ($108,691, a difference of 0.17%).
DemographicsRating | RankMedian Family Income
Immigrants | North Macedonia
96.4
/100
|
#107
Exceptional
$109,136
Immigrants | Zimbabwe
95.9
/100
|
#108
Exceptional
$108,830
Immigrants | Afghanistan
95.6
/100
|
#109
Exceptional
$108,709
British
95.6
/100
|
#110
Exceptional
$108,705
Immigrants | Western Asia
95.6
/100
|
#111
Exceptional
$108,691
Immigrants | Poland
95.3
/100
|
#112
Exceptional
$108,570
Immigrants | Saudi Arabia
95.2
/100
|
#113
Exceptional
$108,544
Poles
95.2
/100
|
#114
Exceptional
$108,507
Swedes
95.1
/100
|
#115
Exceptional
$108,499
Chileans
95.0
/100
|
#116
Exceptional
$108,429
Immigrants | Philippines
94.6
/100
|
#117
Exceptional
$108,288
Ethiopians
94.5
/100
|
#118
Exceptional
$108,251
Sri Lankans
94.5
/100
|
#119
Exceptional
$108,234
Immigrants | Northern Africa
94.3
/100
|
#120
Exceptional
$108,161
Europeans
94.1
/100
|
#121
Exceptional
$108,099