Cree vs Immigrants from Ecuador Median Family Income
COMPARE
Cree
Immigrants from Ecuador
Median Family Income
Median Family Income Comparison
Cree
Immigrants from Ecuador
$90,882
MEDIAN FAMILY INCOME
0.2/ 100
METRIC RATING
268th/ 347
METRIC RANK
$92,837
MEDIAN FAMILY INCOME
0.7/ 100
METRIC RATING
249th/ 347
METRIC RANK
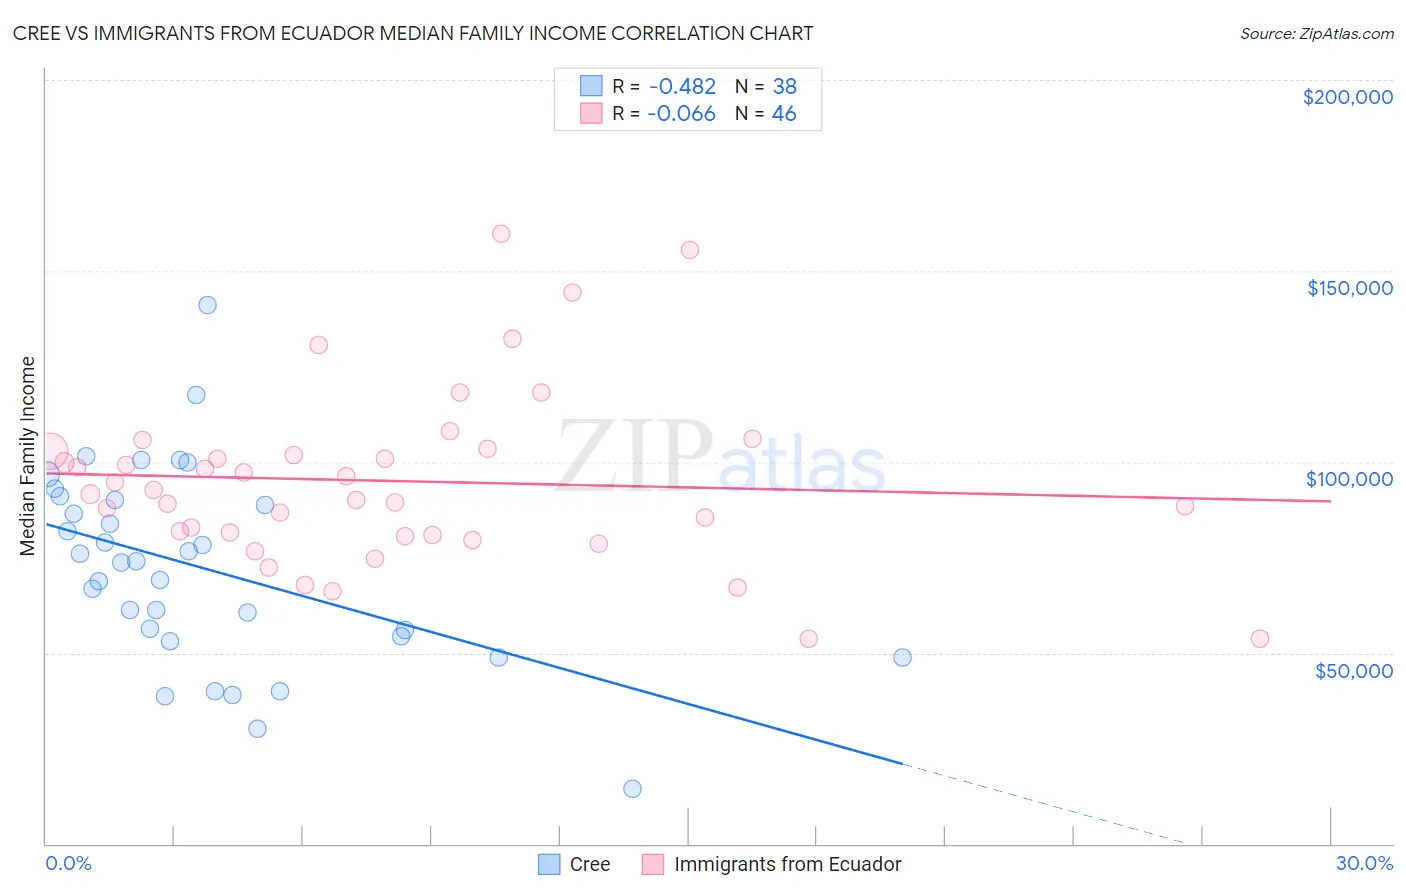
Cree vs Immigrants from Ecuador Median Family Income Correlation Chart
The statistical analysis conducted on geographies consisting of 76,200,070 people shows a moderate negative correlation between the proportion of Cree and median family income in the United States with a correlation coefficient (R) of -0.482 and weighted average of $90,882. Similarly, the statistical analysis conducted on geographies consisting of 270,846,171 people shows a slight negative correlation between the proportion of Immigrants from Ecuador and median family income in the United States with a correlation coefficient (R) of -0.066 and weighted average of $92,837, a difference of 2.1%.
Median Family Income Correlation Summary
| Measurement | Cree | Immigrants from Ecuador |
| Minimum | $14,519 | $53,750 |
| Maximum | $140,987 | $159,896 |
| Range | $126,468 | $106,146 |
| Mean | $71,996 | $95,020 |
| Median | $73,827 | $92,088 |
| Interquartile 25% (IQ1) | $54,375 | $80,966 |
| Interquartile 75% (IQ3) | $90,158 | $102,770 |
| Interquartile Range (IQR) | $35,783 | $21,804 |
| Standard Deviation (Sample) | $25,840 | $22,898 |
| Standard Deviation (Population) | $25,498 | $22,647 |
Demographics Similar to Cree and Immigrants from Ecuador by Median Family Income
In terms of median family income, the demographic groups most similar to Cree are Mexican American Indian ($90,918, a difference of 0.040%), Central American ($91,087, a difference of 0.23%), Hmong ($91,296, a difference of 0.46%), Senegalese ($91,475, a difference of 0.65%), and Immigrants from West Indies ($91,588, a difference of 0.78%). Similarly, the demographic groups most similar to Immigrants from Ecuador are French American Indian ($92,872, a difference of 0.040%), West Indian ($92,765, a difference of 0.080%), Immigrants from Somalia ($92,609, a difference of 0.25%), Immigrants from El Salvador ($92,545, a difference of 0.32%), and Immigrants from Guyana ($92,513, a difference of 0.35%).
| Demographics | Rating | Rank | Median Family Income |
| French American Indians | 0.7 /100 | #248 | Tragic $92,872 |
| Immigrants | Ecuador | 0.7 /100 | #249 | Tragic $92,837 |
| West Indians | 0.6 /100 | #250 | Tragic $92,765 |
| Immigrants | Somalia | 0.6 /100 | #251 | Tragic $92,609 |
| Immigrants | El Salvador | 0.6 /100 | #252 | Tragic $92,545 |
| Immigrants | Guyana | 0.6 /100 | #253 | Tragic $92,513 |
| Immigrants | Barbados | 0.5 /100 | #254 | Tragic $92,419 |
| Immigrants | Laos | 0.5 /100 | #255 | Tragic $92,239 |
| Nicaraguans | 0.5 /100 | #256 | Tragic $92,231 |
| Americans | 0.4 /100 | #257 | Tragic $92,096 |
| Osage | 0.4 /100 | #258 | Tragic $91,926 |
| Cape Verdeans | 0.4 /100 | #259 | Tragic $91,848 |
| Pennsylvania Germans | 0.4 /100 | #260 | Tragic $91,763 |
| Inupiat | 0.4 /100 | #261 | Tragic $91,730 |
| Liberians | 0.4 /100 | #262 | Tragic $91,722 |
| Immigrants | West Indies | 0.3 /100 | #263 | Tragic $91,588 |
| Senegalese | 0.3 /100 | #264 | Tragic $91,475 |
| Hmong | 0.3 /100 | #265 | Tragic $91,296 |
| Central Americans | 0.3 /100 | #266 | Tragic $91,087 |
| Mexican American Indians | 0.2 /100 | #267 | Tragic $90,918 |
| Cree | 0.2 /100 | #268 | Tragic $90,882 |