Israeli vs Immigrants from Ecuador Median Family Income
COMPARE
Israeli
Immigrants from Ecuador
Median Family Income
Median Family Income Comparison
Israelis
Immigrants from Ecuador
$118,577
MEDIAN FAMILY INCOME
100.0/ 100
METRIC RATING
36th/ 347
METRIC RANK
$92,837
MEDIAN FAMILY INCOME
0.7/ 100
METRIC RATING
249th/ 347
METRIC RANK
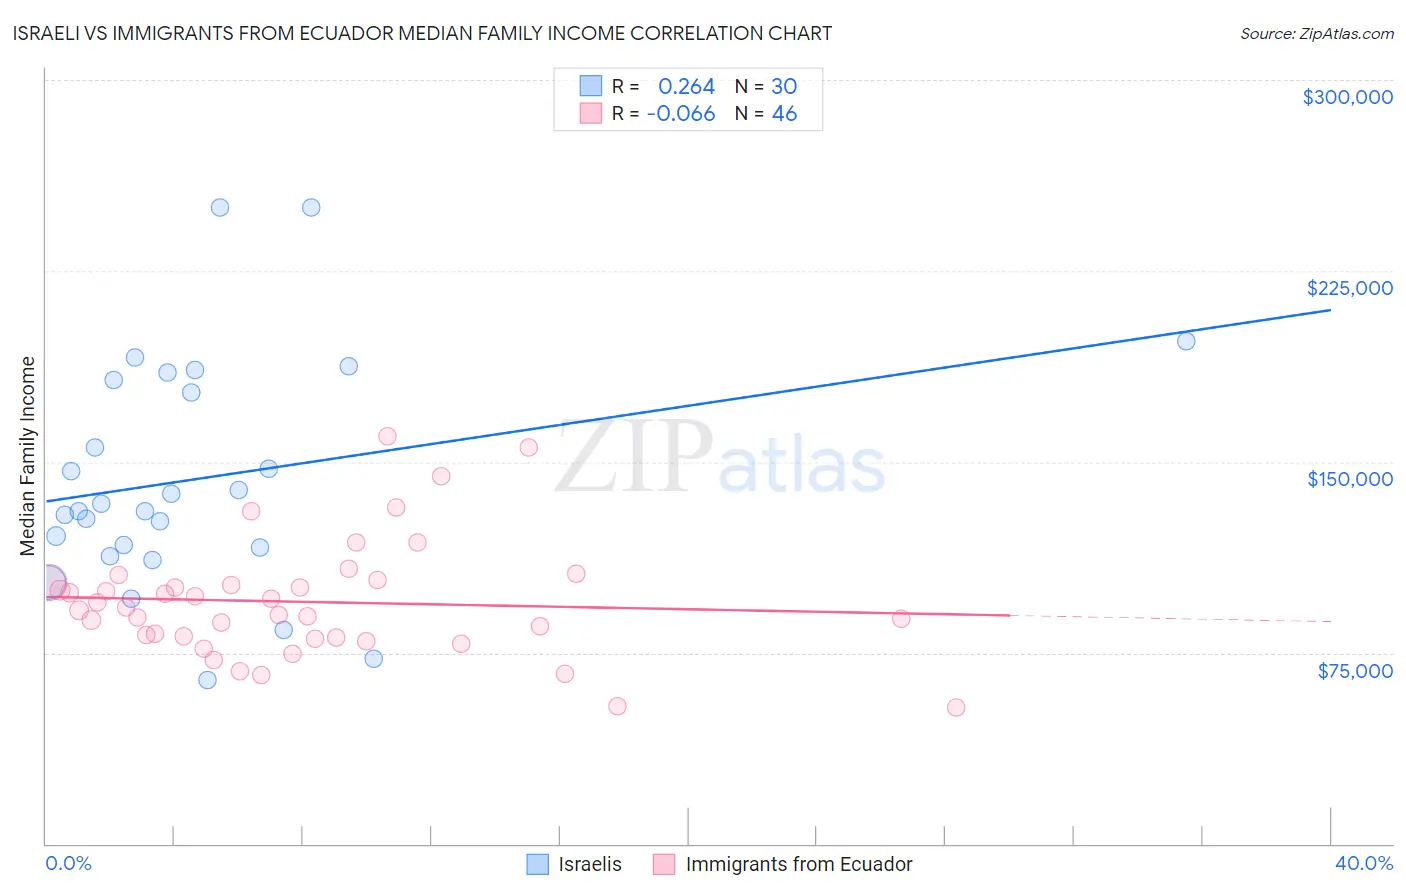
Israeli vs Immigrants from Ecuador Median Family Income Correlation Chart
The statistical analysis conducted on geographies consisting of 210,932,899 people shows a weak positive correlation between the proportion of Israelis and median family income in the United States with a correlation coefficient (R) of 0.264 and weighted average of $118,577. Similarly, the statistical analysis conducted on geographies consisting of 270,846,171 people shows a slight negative correlation between the proportion of Immigrants from Ecuador and median family income in the United States with a correlation coefficient (R) of -0.066 and weighted average of $92,837, a difference of 27.7%.
Median Family Income Correlation Summary
| Measurement | Israeli | Immigrants from Ecuador |
| Minimum | $64,441 | $53,750 |
| Maximum | $250,001 | $159,896 |
| Range | $185,560 | $106,146 |
| Mean | $143,645 | $95,020 |
| Median | $132,084 | $92,088 |
| Interquartile 25% (IQ1) | $116,332 | $80,966 |
| Interquartile 75% (IQ3) | $182,189 | $102,770 |
| Interquartile Range (IQR) | $65,857 | $21,804 |
| Standard Deviation (Sample) | $45,469 | $22,898 |
| Standard Deviation (Population) | $44,705 | $22,647 |
Similar Demographics by Median Family Income
Demographics Similar to Israelis by Median Family Income
In terms of median family income, the demographic groups most similar to Israelis are Australian ($118,440, a difference of 0.12%), Immigrants from Turkey ($118,325, a difference of 0.21%), Immigrants from Asia ($118,291, a difference of 0.24%), Immigrants from Lithuania ($118,053, a difference of 0.44%), and Estonian ($118,013, a difference of 0.48%).
| Demographics | Rating | Rank | Median Family Income |
| Latvians | 100.0 /100 | #29 | Exceptional $120,301 |
| Immigrants | Sri Lanka | 100.0 /100 | #30 | Exceptional $120,263 |
| Immigrants | France | 100.0 /100 | #31 | Exceptional $120,076 |
| Asians | 100.0 /100 | #32 | Exceptional $119,955 |
| Bhutanese | 100.0 /100 | #33 | Exceptional $119,800 |
| Bolivians | 100.0 /100 | #34 | Exceptional $119,479 |
| Soviet Union | 100.0 /100 | #35 | Exceptional $119,262 |
| Israelis | 100.0 /100 | #36 | Exceptional $118,577 |
| Australians | 100.0 /100 | #37 | Exceptional $118,440 |
| Immigrants | Turkey | 100.0 /100 | #38 | Exceptional $118,325 |
| Immigrants | Asia | 100.0 /100 | #39 | Exceptional $118,291 |
| Immigrants | Lithuania | 100.0 /100 | #40 | Exceptional $118,053 |
| Estonians | 100.0 /100 | #41 | Exceptional $118,013 |
| Immigrants | Bolivia | 100.0 /100 | #42 | Exceptional $117,912 |
| Bulgarians | 100.0 /100 | #43 | Exceptional $117,818 |
Demographics Similar to Immigrants from Ecuador by Median Family Income
In terms of median family income, the demographic groups most similar to Immigrants from Ecuador are French American Indian ($92,872, a difference of 0.040%), Immigrants from Senegal ($92,912, a difference of 0.080%), West Indian ($92,765, a difference of 0.080%), Immigrants from Somalia ($92,609, a difference of 0.25%), and Immigrants from El Salvador ($92,545, a difference of 0.32%).
| Demographics | Rating | Rank | Median Family Income |
| Barbadians | 1.1 /100 | #242 | Tragic $93,919 |
| German Russians | 1.1 /100 | #243 | Tragic $93,858 |
| Sub-Saharan Africans | 1.0 /100 | #244 | Tragic $93,748 |
| Immigrants | Middle Africa | 1.0 /100 | #245 | Tragic $93,593 |
| Guyanese | 0.9 /100 | #246 | Tragic $93,373 |
| Immigrants | Senegal | 0.7 /100 | #247 | Tragic $92,912 |
| French American Indians | 0.7 /100 | #248 | Tragic $92,872 |
| Immigrants | Ecuador | 0.7 /100 | #249 | Tragic $92,837 |
| West Indians | 0.6 /100 | #250 | Tragic $92,765 |
| Immigrants | Somalia | 0.6 /100 | #251 | Tragic $92,609 |
| Immigrants | El Salvador | 0.6 /100 | #252 | Tragic $92,545 |
| Immigrants | Guyana | 0.6 /100 | #253 | Tragic $92,513 |
| Immigrants | Barbados | 0.5 /100 | #254 | Tragic $92,419 |
| Immigrants | Laos | 0.5 /100 | #255 | Tragic $92,239 |
| Nicaraguans | 0.5 /100 | #256 | Tragic $92,231 |