Immigrants from Nigeria vs Immigrants from Ecuador Median Family Income
COMPARE
Immigrants from Nigeria
Immigrants from Ecuador
Median Family Income
Median Family Income Comparison
Immigrants from Nigeria
Immigrants from Ecuador
$96,439
MEDIAN FAMILY INCOME
4.0/ 100
METRIC RATING
222nd/ 347
METRIC RANK
$92,837
MEDIAN FAMILY INCOME
0.7/ 100
METRIC RATING
249th/ 347
METRIC RANK
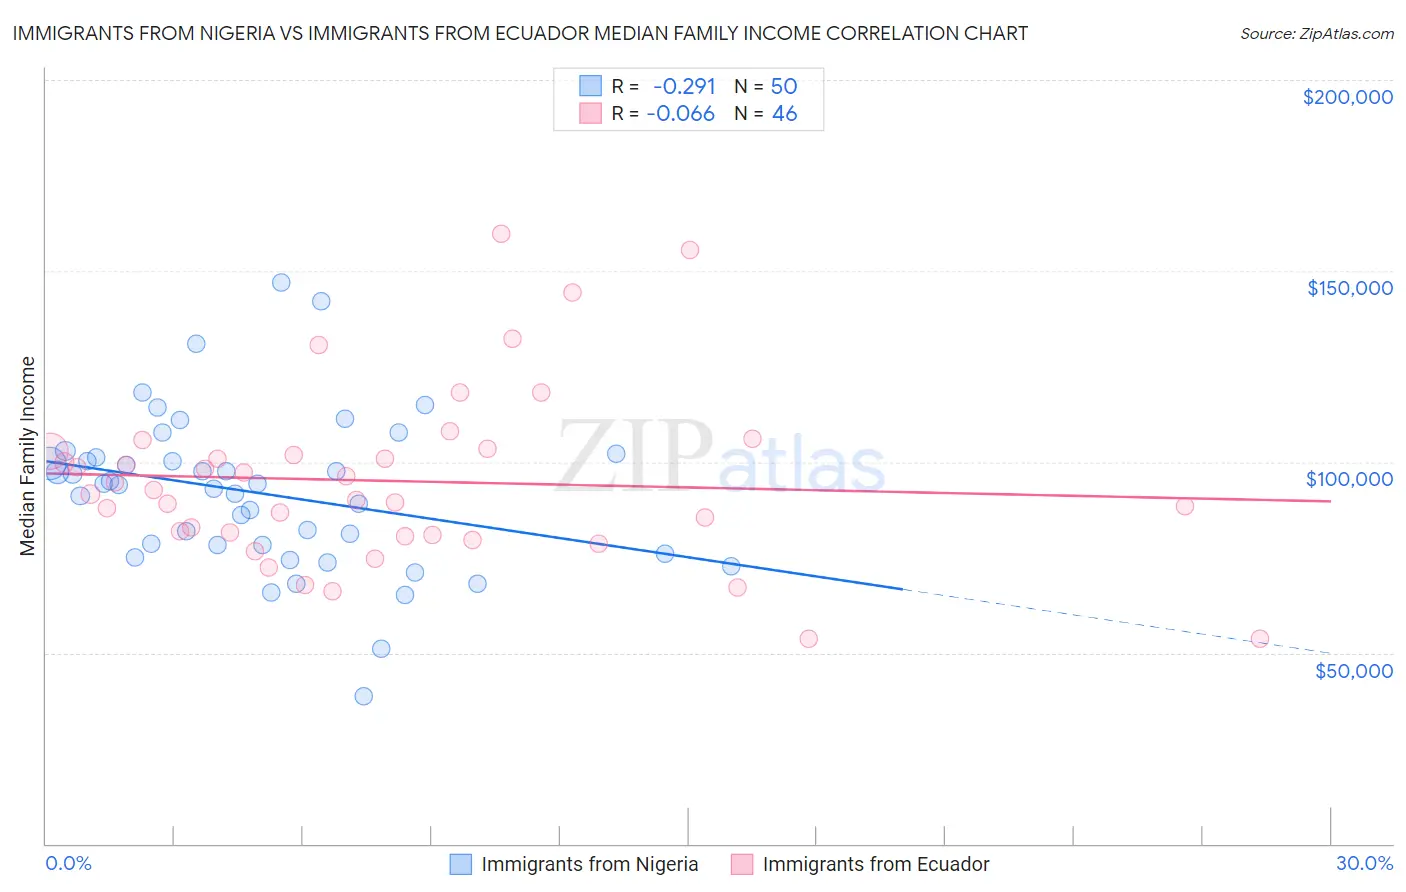
Immigrants from Nigeria vs Immigrants from Ecuador Median Family Income Correlation Chart
The statistical analysis conducted on geographies consisting of 283,210,915 people shows a weak negative correlation between the proportion of Immigrants from Nigeria and median family income in the United States with a correlation coefficient (R) of -0.291 and weighted average of $96,439. Similarly, the statistical analysis conducted on geographies consisting of 270,846,171 people shows a slight negative correlation between the proportion of Immigrants from Ecuador and median family income in the United States with a correlation coefficient (R) of -0.066 and weighted average of $92,837, a difference of 3.9%.
Median Family Income Correlation Summary
| Measurement | Immigrants from Nigeria | Immigrants from Ecuador |
| Minimum | $38,750 | $53,750 |
| Maximum | $147,129 | $159,896 |
| Range | $108,379 | $106,146 |
| Mean | $91,848 | $95,020 |
| Median | $94,194 | $92,088 |
| Interquartile 25% (IQ1) | $78,280 | $80,966 |
| Interquartile 75% (IQ3) | $101,295 | $102,770 |
| Interquartile Range (IQR) | $23,014 | $21,804 |
| Standard Deviation (Sample) | $20,578 | $22,898 |
| Standard Deviation (Population) | $20,371 | $22,647 |
Similar Demographics by Median Family Income
Demographics Similar to Immigrants from Nigeria by Median Family Income
In terms of median family income, the demographic groups most similar to Immigrants from Nigeria are Immigrants from Ghana ($96,544, a difference of 0.11%), Venezuelan ($96,281, a difference of 0.16%), Nonimmigrants ($96,231, a difference of 0.22%), Vietnamese ($96,123, a difference of 0.33%), and Sudanese ($96,783, a difference of 0.36%).
| Demographics | Rating | Rank | Median Family Income |
| Nigerians | 6.7 /100 | #215 | Tragic $97,522 |
| Immigrants | Bosnia and Herzegovina | 6.4 /100 | #216 | Tragic $97,432 |
| Japanese | 6.0 /100 | #217 | Tragic $97,288 |
| Immigrants | Cambodia | 5.8 /100 | #218 | Tragic $97,222 |
| Delaware | 5.1 /100 | #219 | Tragic $96,958 |
| Sudanese | 4.7 /100 | #220 | Tragic $96,783 |
| Immigrants | Ghana | 4.2 /100 | #221 | Tragic $96,544 |
| Immigrants | Nigeria | 4.0 /100 | #222 | Tragic $96,439 |
| Venezuelans | 3.7 /100 | #223 | Tragic $96,281 |
| Immigrants | Nonimmigrants | 3.6 /100 | #224 | Tragic $96,231 |
| Vietnamese | 3.4 /100 | #225 | Tragic $96,123 |
| Immigrants | Panama | 2.7 /100 | #226 | Tragic $95,647 |
| Alaska Natives | 2.6 /100 | #227 | Tragic $95,573 |
| Immigrants | Azores | 2.4 /100 | #228 | Tragic $95,402 |
| Marshallese | 2.2 /100 | #229 | Tragic $95,293 |
Demographics Similar to Immigrants from Ecuador by Median Family Income
In terms of median family income, the demographic groups most similar to Immigrants from Ecuador are French American Indian ($92,872, a difference of 0.040%), Immigrants from Senegal ($92,912, a difference of 0.080%), West Indian ($92,765, a difference of 0.080%), Immigrants from Somalia ($92,609, a difference of 0.25%), and Immigrants from El Salvador ($92,545, a difference of 0.32%).
| Demographics | Rating | Rank | Median Family Income |
| Barbadians | 1.1 /100 | #242 | Tragic $93,919 |
| German Russians | 1.1 /100 | #243 | Tragic $93,858 |
| Sub-Saharan Africans | 1.0 /100 | #244 | Tragic $93,748 |
| Immigrants | Middle Africa | 1.0 /100 | #245 | Tragic $93,593 |
| Guyanese | 0.9 /100 | #246 | Tragic $93,373 |
| Immigrants | Senegal | 0.7 /100 | #247 | Tragic $92,912 |
| French American Indians | 0.7 /100 | #248 | Tragic $92,872 |
| Immigrants | Ecuador | 0.7 /100 | #249 | Tragic $92,837 |
| West Indians | 0.6 /100 | #250 | Tragic $92,765 |
| Immigrants | Somalia | 0.6 /100 | #251 | Tragic $92,609 |
| Immigrants | El Salvador | 0.6 /100 | #252 | Tragic $92,545 |
| Immigrants | Guyana | 0.6 /100 | #253 | Tragic $92,513 |
| Immigrants | Barbados | 0.5 /100 | #254 | Tragic $92,419 |
| Immigrants | Laos | 0.5 /100 | #255 | Tragic $92,239 |
| Nicaraguans | 0.5 /100 | #256 | Tragic $92,231 |