Osage vs Immigrants from Ecuador Median Family Income
COMPARE
Osage
Immigrants from Ecuador
Median Family Income
Median Family Income Comparison
Osage
Immigrants from Ecuador
$91,926
MEDIAN FAMILY INCOME
0.4/ 100
METRIC RATING
258th/ 347
METRIC RANK
$92,837
MEDIAN FAMILY INCOME
0.7/ 100
METRIC RATING
249th/ 347
METRIC RANK
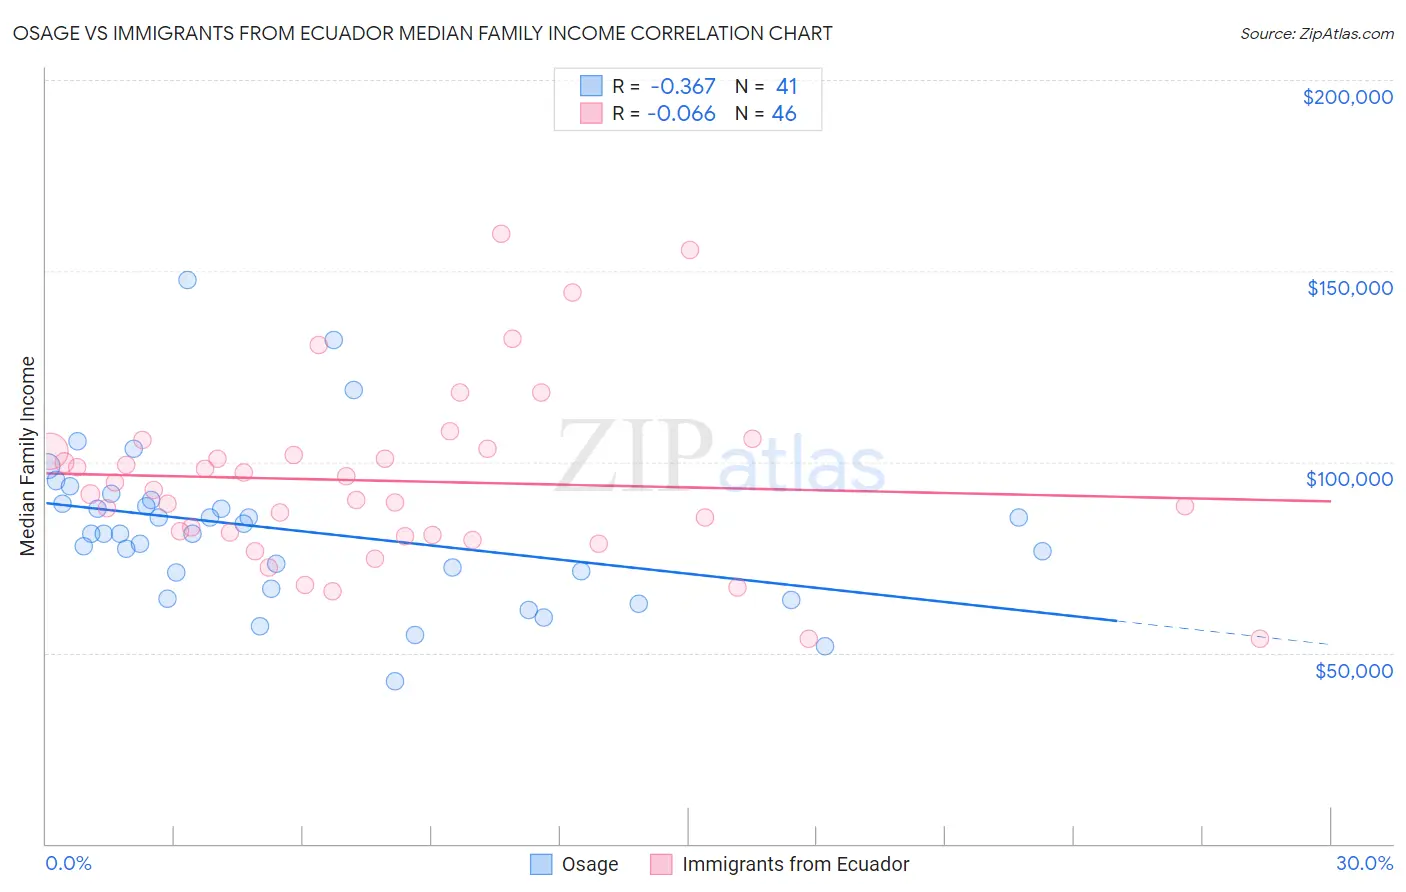
Osage vs Immigrants from Ecuador Median Family Income Correlation Chart
The statistical analysis conducted on geographies consisting of 91,794,477 people shows a mild negative correlation between the proportion of Osage and median family income in the United States with a correlation coefficient (R) of -0.367 and weighted average of $91,926. Similarly, the statistical analysis conducted on geographies consisting of 270,846,171 people shows a slight negative correlation between the proportion of Immigrants from Ecuador and median family income in the United States with a correlation coefficient (R) of -0.066 and weighted average of $92,837, a difference of 0.99%.
Median Family Income Correlation Summary
| Measurement | Osage | Immigrants from Ecuador |
| Minimum | $42,500 | $53,750 |
| Maximum | $147,522 | $159,896 |
| Range | $105,022 | $106,146 |
| Mean | $81,978 | $95,020 |
| Median | $81,165 | $92,088 |
| Interquartile 25% (IQ1) | $68,927 | $80,966 |
| Interquartile 75% (IQ3) | $89,553 | $102,770 |
| Interquartile Range (IQR) | $20,626 | $21,804 |
| Standard Deviation (Sample) | $20,387 | $22,898 |
| Standard Deviation (Population) | $20,137 | $22,647 |
Demographics Similar to Osage and Immigrants from Ecuador by Median Family Income
In terms of median family income, the demographic groups most similar to Osage are Cape Verdean ($91,848, a difference of 0.090%), Pennsylvania German ($91,763, a difference of 0.18%), American ($92,096, a difference of 0.19%), Inupiat ($91,730, a difference of 0.21%), and Liberian ($91,722, a difference of 0.22%). Similarly, the demographic groups most similar to Immigrants from Ecuador are French American Indian ($92,872, a difference of 0.040%), Immigrants from Senegal ($92,912, a difference of 0.080%), West Indian ($92,765, a difference of 0.080%), Immigrants from Somalia ($92,609, a difference of 0.25%), and Immigrants from El Salvador ($92,545, a difference of 0.32%).
| Demographics | Rating | Rank | Median Family Income |
| German Russians | 1.1 /100 | #243 | Tragic $93,858 |
| Sub-Saharan Africans | 1.0 /100 | #244 | Tragic $93,748 |
| Immigrants | Middle Africa | 1.0 /100 | #245 | Tragic $93,593 |
| Guyanese | 0.9 /100 | #246 | Tragic $93,373 |
| Immigrants | Senegal | 0.7 /100 | #247 | Tragic $92,912 |
| French American Indians | 0.7 /100 | #248 | Tragic $92,872 |
| Immigrants | Ecuador | 0.7 /100 | #249 | Tragic $92,837 |
| West Indians | 0.6 /100 | #250 | Tragic $92,765 |
| Immigrants | Somalia | 0.6 /100 | #251 | Tragic $92,609 |
| Immigrants | El Salvador | 0.6 /100 | #252 | Tragic $92,545 |
| Immigrants | Guyana | 0.6 /100 | #253 | Tragic $92,513 |
| Immigrants | Barbados | 0.5 /100 | #254 | Tragic $92,419 |
| Immigrants | Laos | 0.5 /100 | #255 | Tragic $92,239 |
| Nicaraguans | 0.5 /100 | #256 | Tragic $92,231 |
| Americans | 0.4 /100 | #257 | Tragic $92,096 |
| Osage | 0.4 /100 | #258 | Tragic $91,926 |
| Cape Verdeans | 0.4 /100 | #259 | Tragic $91,848 |
| Pennsylvania Germans | 0.4 /100 | #260 | Tragic $91,763 |
| Inupiat | 0.4 /100 | #261 | Tragic $91,730 |
| Liberians | 0.4 /100 | #262 | Tragic $91,722 |
| Immigrants | West Indies | 0.3 /100 | #263 | Tragic $91,588 |