Shoshone vs Chickasaw Median Family Income
COMPARE
Shoshone
Chickasaw
Median Family Income
Median Family Income Comparison
Shoshone
Chickasaw
$87,872
MEDIAN FAMILY INCOME
0.1/ 100
METRIC RATING
290th/ 347
METRIC RANK
$85,356
MEDIAN FAMILY INCOME
0.0/ 100
METRIC RATING
307th/ 347
METRIC RANK
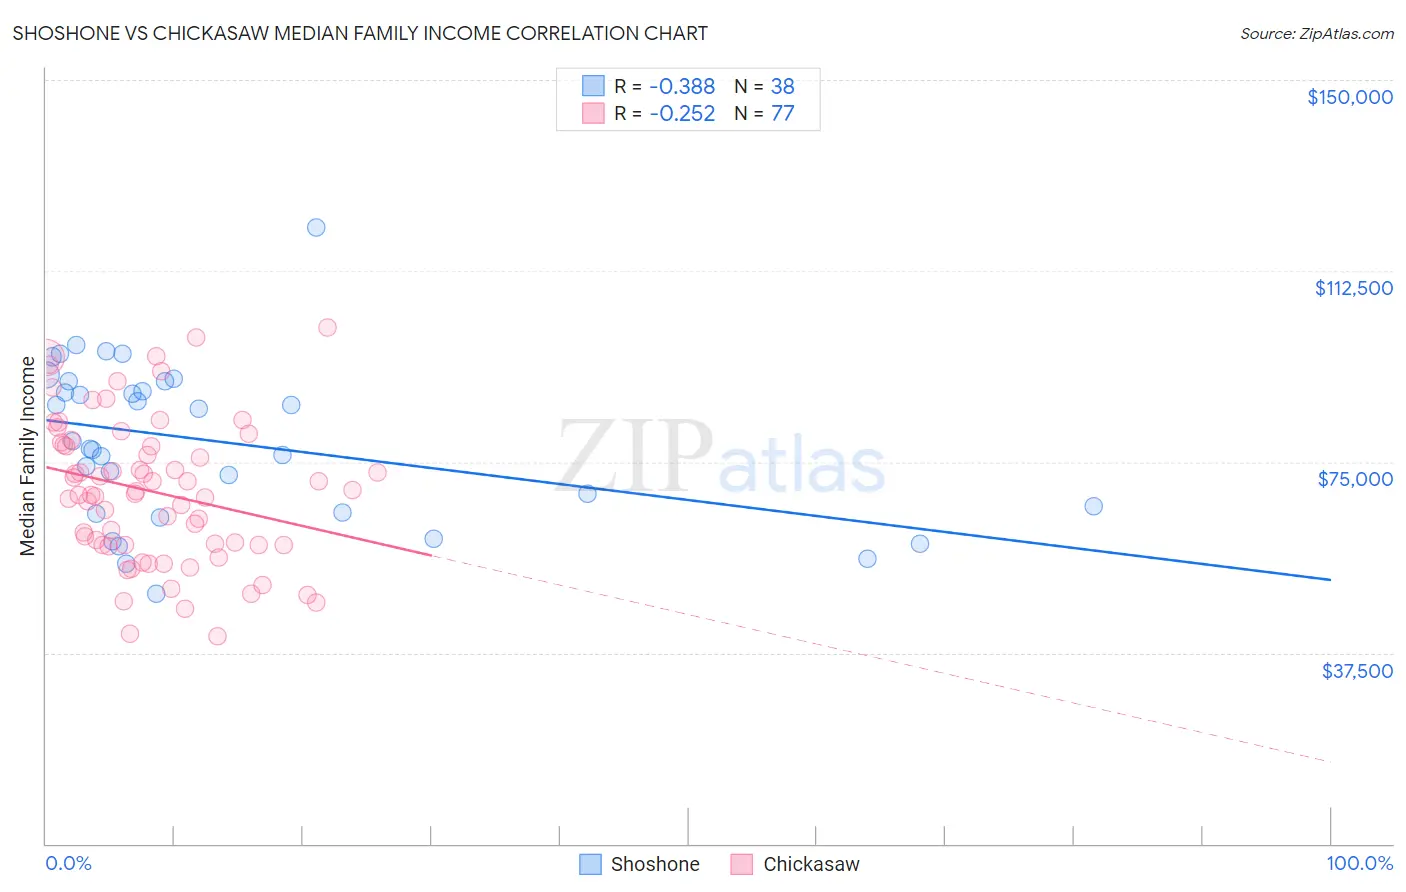
Shoshone vs Chickasaw Median Family Income Correlation Chart
The statistical analysis conducted on geographies consisting of 66,610,248 people shows a mild negative correlation between the proportion of Shoshone and median family income in the United States with a correlation coefficient (R) of -0.388 and weighted average of $87,872. Similarly, the statistical analysis conducted on geographies consisting of 147,660,168 people shows a weak negative correlation between the proportion of Chickasaw and median family income in the United States with a correlation coefficient (R) of -0.252 and weighted average of $85,356, a difference of 2.9%.
Median Family Income Correlation Summary
| Measurement | Shoshone | Chickasaw |
| Minimum | $49,050 | $40,774 |
| Maximum | $121,000 | $101,302 |
| Range | $71,950 | $60,528 |
| Mean | $78,936 | $69,119 |
| Median | $78,378 | $68,772 |
| Interquartile 25% (IQ1) | $65,000 | $58,750 |
| Interquartile 75% (IQ3) | $90,917 | $78,533 |
| Interquartile Range (IQR) | $25,917 | $19,783 |
| Standard Deviation (Sample) | $15,660 | $14,096 |
| Standard Deviation (Population) | $15,453 | $14,004 |
Demographics Similar to Shoshone and Chickasaw by Median Family Income
In terms of median family income, the demographic groups most similar to Shoshone are Immigrants from Cabo Verde ($87,830, a difference of 0.050%), African ($87,820, a difference of 0.060%), Central American Indian ($88,034, a difference of 0.19%), Ute ($87,596, a difference of 0.32%), and Cherokee ($88,209, a difference of 0.38%). Similarly, the demographic groups most similar to Chickasaw are Immigrants from Dominica ($85,411, a difference of 0.060%), Paiute ($85,414, a difference of 0.070%), U.S. Virgin Islander ($85,294, a difference of 0.070%), Mexican ($85,618, a difference of 0.31%), and Hispanic or Latino ($85,647, a difference of 0.34%).
| Demographics | Rating | Rank | Median Family Income |
| Cherokee | 0.1 /100 | #288 | Tragic $88,209 |
| Central American Indians | 0.1 /100 | #289 | Tragic $88,034 |
| Shoshone | 0.1 /100 | #290 | Tragic $87,872 |
| Immigrants | Cabo Verde | 0.1 /100 | #291 | Tragic $87,830 |
| Africans | 0.1 /100 | #292 | Tragic $87,820 |
| Ute | 0.0 /100 | #293 | Tragic $87,596 |
| Fijians | 0.0 /100 | #294 | Tragic $87,387 |
| Yaqui | 0.0 /100 | #295 | Tragic $87,289 |
| Immigrants | Guatemala | 0.0 /100 | #296 | Tragic $87,191 |
| Cajuns | 0.0 /100 | #297 | Tragic $87,157 |
| Immigrants | Latin America | 0.0 /100 | #298 | Tragic $86,989 |
| Chippewa | 0.0 /100 | #299 | Tragic $86,852 |
| Ottawa | 0.0 /100 | #300 | Tragic $86,380 |
| Colville | 0.0 /100 | #301 | Tragic $85,792 |
| Spanish American Indians | 0.0 /100 | #302 | Tragic $85,728 |
| Hispanics or Latinos | 0.0 /100 | #303 | Tragic $85,647 |
| Mexicans | 0.0 /100 | #304 | Tragic $85,618 |
| Paiute | 0.0 /100 | #305 | Tragic $85,414 |
| Immigrants | Dominica | 0.0 /100 | #306 | Tragic $85,411 |
| Chickasaw | 0.0 /100 | #307 | Tragic $85,356 |
| U.S. Virgin Islanders | 0.0 /100 | #308 | Tragic $85,294 |