Immigrants from India vs Chickasaw Median Family Income
COMPARE
Immigrants from India
Chickasaw
Median Family Income
Median Family Income Comparison
Immigrants from India
Chickasaw
$134,028
MEDIAN FAMILY INCOME
100.0/ 100
METRIC RATING
4th/ 347
METRIC RANK
$85,356
MEDIAN FAMILY INCOME
0.0/ 100
METRIC RATING
307th/ 347
METRIC RANK
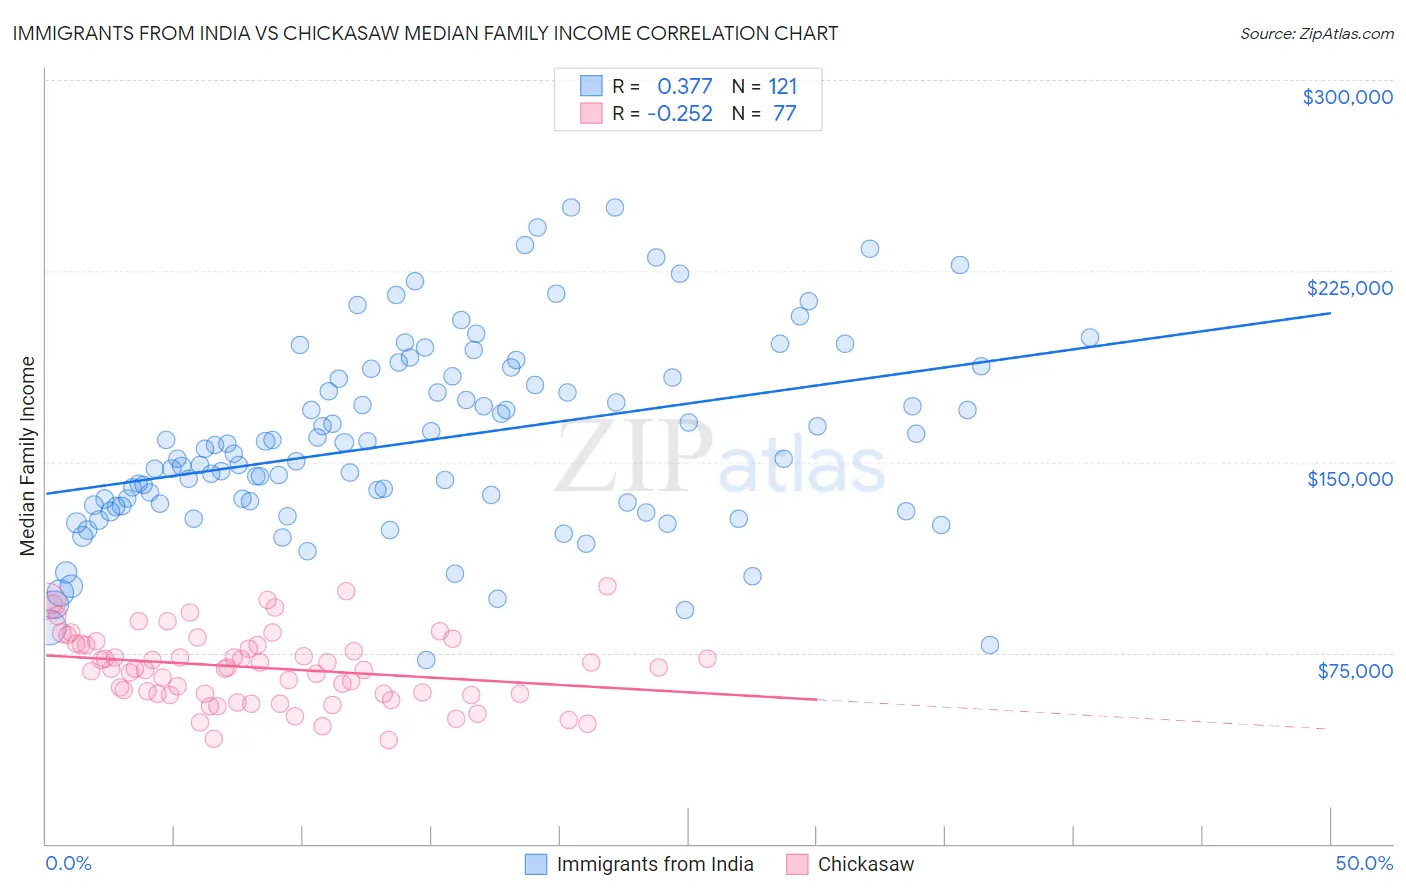
Immigrants from India vs Chickasaw Median Family Income Correlation Chart
The statistical analysis conducted on geographies consisting of 433,562,423 people shows a mild positive correlation between the proportion of Immigrants from India and median family income in the United States with a correlation coefficient (R) of 0.377 and weighted average of $134,028. Similarly, the statistical analysis conducted on geographies consisting of 147,660,168 people shows a weak negative correlation between the proportion of Chickasaw and median family income in the United States with a correlation coefficient (R) of -0.252 and weighted average of $85,356, a difference of 57.0%.
Median Family Income Correlation Summary
| Measurement | Immigrants from India | Chickasaw |
| Minimum | $71,983 | $40,774 |
| Maximum | $250,001 | $101,302 |
| Range | $178,018 | $60,528 |
| Mean | $158,155 | $69,119 |
| Median | $153,095 | $68,772 |
| Interquartile 25% (IQ1) | $132,876 | $58,750 |
| Interquartile 75% (IQ3) | $183,418 | $78,533 |
| Interquartile Range (IQR) | $50,542 | $19,783 |
| Standard Deviation (Sample) | $37,573 | $14,096 |
| Standard Deviation (Population) | $37,418 | $14,004 |
Similar Demographics by Median Family Income
Demographics Similar to Immigrants from India by Median Family Income
In terms of median family income, the demographic groups most similar to Immigrants from India are Iranian ($133,839, a difference of 0.14%), Immigrants from Singapore ($134,818, a difference of 0.59%), Thai ($131,281, a difference of 2.1%), Immigrants from Taiwan ($136,949, a difference of 2.2%), and Immigrants from Hong Kong ($131,067, a difference of 2.3%).
| Demographics | Rating | Rank | Median Family Income |
| Filipinos | 100.0 /100 | #1 | Exceptional $138,397 |
| Immigrants | Taiwan | 100.0 /100 | #2 | Exceptional $136,949 |
| Immigrants | Singapore | 100.0 /100 | #3 | Exceptional $134,818 |
| Immigrants | India | 100.0 /100 | #4 | Exceptional $134,028 |
| Iranians | 100.0 /100 | #5 | Exceptional $133,839 |
| Thais | 100.0 /100 | #6 | Exceptional $131,281 |
| Immigrants | Hong Kong | 100.0 /100 | #7 | Exceptional $131,067 |
| Immigrants | Iran | 100.0 /100 | #8 | Exceptional $130,894 |
| Okinawans | 100.0 /100 | #9 | Exceptional $129,979 |
| Immigrants | Ireland | 100.0 /100 | #10 | Exceptional $127,584 |
| Immigrants | Israel | 100.0 /100 | #11 | Exceptional $127,430 |
| Cypriots | 100.0 /100 | #12 | Exceptional $127,064 |
| Immigrants | Australia | 100.0 /100 | #13 | Exceptional $126,620 |
| Immigrants | South Central Asia | 100.0 /100 | #14 | Exceptional $125,956 |
| Eastern Europeans | 100.0 /100 | #15 | Exceptional $125,546 |
Demographics Similar to Chickasaw by Median Family Income
In terms of median family income, the demographic groups most similar to Chickasaw are Immigrants from Dominica ($85,411, a difference of 0.060%), Paiute ($85,414, a difference of 0.070%), U.S. Virgin Islander ($85,294, a difference of 0.070%), Haitian ($85,218, a difference of 0.16%), and Mexican ($85,618, a difference of 0.31%).
| Demographics | Rating | Rank | Median Family Income |
| Ottawa | 0.0 /100 | #300 | Tragic $86,380 |
| Colville | 0.0 /100 | #301 | Tragic $85,792 |
| Spanish American Indians | 0.0 /100 | #302 | Tragic $85,728 |
| Hispanics or Latinos | 0.0 /100 | #303 | Tragic $85,647 |
| Mexicans | 0.0 /100 | #304 | Tragic $85,618 |
| Paiute | 0.0 /100 | #305 | Tragic $85,414 |
| Immigrants | Dominica | 0.0 /100 | #306 | Tragic $85,411 |
| Chickasaw | 0.0 /100 | #307 | Tragic $85,356 |
| U.S. Virgin Islanders | 0.0 /100 | #308 | Tragic $85,294 |
| Haitians | 0.0 /100 | #309 | Tragic $85,218 |
| Immigrants | Central America | 0.0 /100 | #310 | Tragic $85,050 |
| Hondurans | 0.0 /100 | #311 | Tragic $85,004 |
| Cubans | 0.0 /100 | #312 | Tragic $84,981 |
| Choctaw | 0.0 /100 | #313 | Tragic $84,835 |
| Immigrants | Bahamas | 0.0 /100 | #314 | Tragic $84,732 |