Zip Codes with the Highest Percentage of Population with a Degree in Literature and Languages in Cumming, GA

RELATED REPORTS & OPTIONS

Literature and Languages
Population
Families and Households
Female Fertility
Female Fertility (Unmarried)
Race (Community Size)
Race (Percentage)
Ancestry (Community Size)
AfricanAmericanArabArgentineanArmenianAustrianBelgianBhutaneseBlackfeetBolivianBrazilianBritishBulgarianBurmeseCajunCanadianCentral AmericanCentral American IndianCherokeeChickasawChileanChoctawColombianCroatianCubanCzechCzechoslovakianDanishDominicanDutchEastern EuropeanEcuadorianEgyptianEnglishEthiopianEuropeanFilipinoFinnishFrenchFrench CanadianGermanGhanaianGreekGuatemalanHaitianHonduranHungarianIndian (Asian)IranianIrishItalianJamaicanKenyanKoreanLatvianLebaneseLithuanianMalaysianMexicanMexican American IndianNative HawaiianNicaraguanNigerianNorthern EuropeanNorwegianPakistaniPeruvianPolishPortuguesePuerto RicanRomanianRussianSalvadoranScandinavianScotch-IrishScottishSerbianSiouxSlavicSlovakSloveneSouth AfricanSouth AmericanSouth American IndianSpaniardSpanishSri LankanSubsaharan AfricanSwedishSwissSyrianThaiTurkishUkrainianUruguayanVenezuelanVietnameseWelshWest IndianYugoslavian
Ancestry (Percentage)
AfricanAmericanArabArgentineanArmenianAustrianBelgianBhutaneseBlackfeetBolivianBrazilianBritishBulgarianBurmeseCajunCanadianCentral AmericanCentral American IndianCherokeeChickasawChileanChoctawColombianCroatianCubanCzechCzechoslovakianDanishDominicanDutchEastern EuropeanEcuadorianEgyptianEnglishEthiopianEuropeanFilipinoFinnishFrenchFrench CanadianGermanGhanaianGreekGuatemalanHaitianHonduranHungarianIndian (Asian)IranianIrishItalianJamaicanKenyanKoreanLatvianLebaneseLithuanianMalaysianMexicanMexican American IndianNative HawaiianNicaraguanNigerianNorthern EuropeanNorwegianPakistaniPeruvianPolishPortuguesePuerto RicanRomanianRussianSalvadoranScandinavianScotch-IrishScottishSerbianSiouxSlavicSlovakSloveneSouth AfricanSouth AmericanSouth American IndianSpaniardSpanishSri LankanSubsaharan AfricanSwedishSwissSyrianThaiTurkishUkrainianUruguayanVenezuelanVietnameseWelshWest IndianYugoslavian
Immigrant Origin (Total)
Immigrant Origin (Percentage)
Income
Income (Families)
Income (Households)
Poverty
Poverty (Families)
Unemployment
Employment Occupations
Employment Industries
Employer Class
Commute Time
Commute Means
School Enrollment
Education by Degree Field
Occupancy
Finances
Physical Characteristics
Cumming
Compare Zip Codes
Comparison Subject

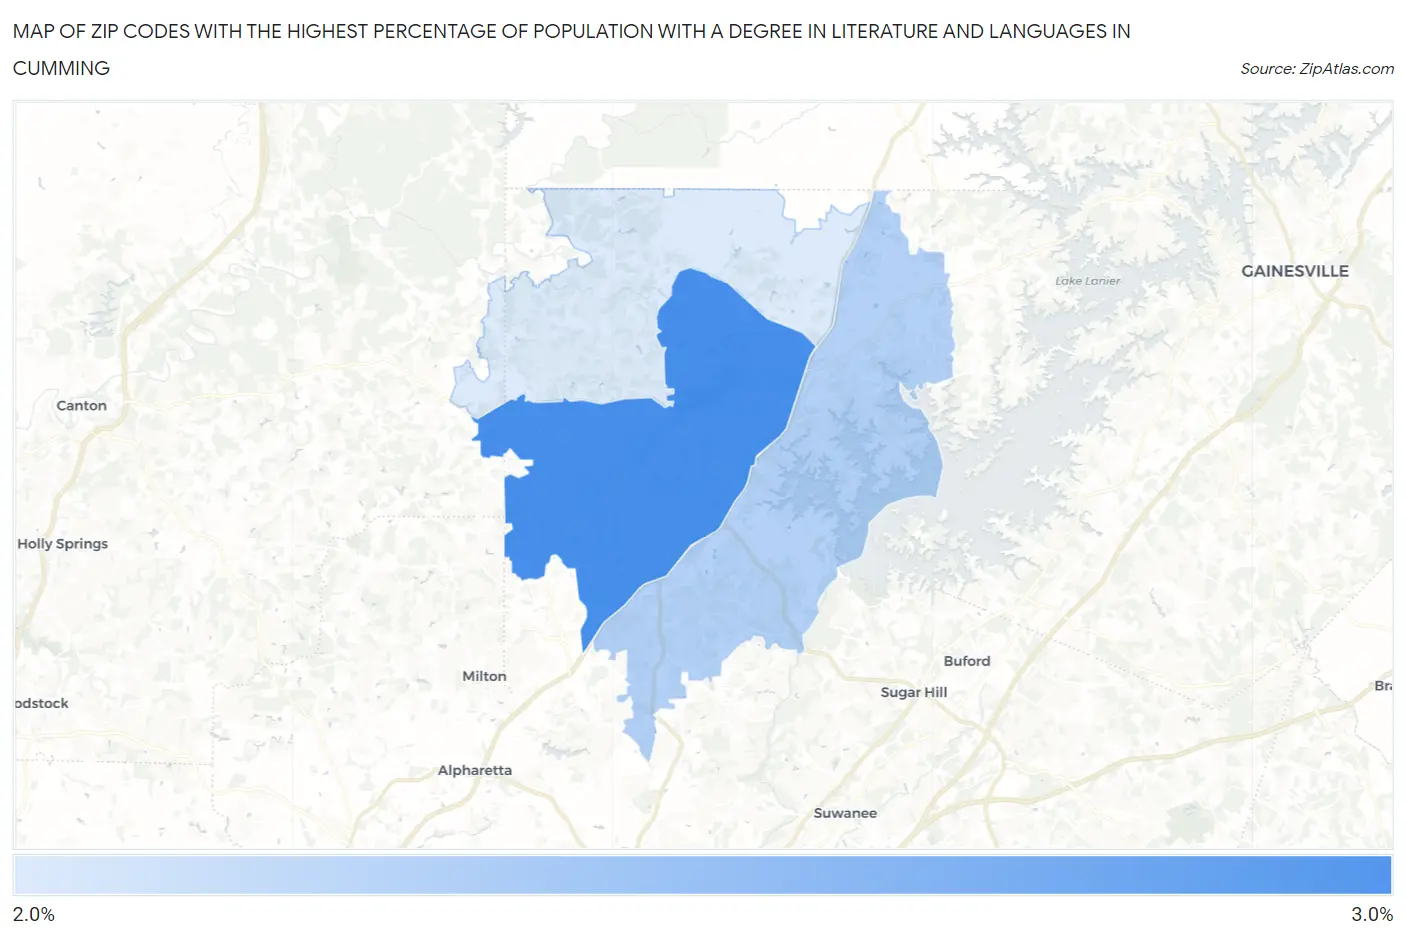
Map of Zip Codes with the Highest Percentage of Population with a Degree in Literature and Languages in Cumming

0.0%
3.0%
Zip Codes with the Highest Percentage of Population with a Degree in Literature and Languages in Cumming Map

Zip Codes with the Highest Percentage of Population with a Degree in Literature and Languages in Cumming, GA

Zip Code % Graduates vs State vs National
1.300402.7%3.6%(-0.933)#2884.4%(-1.72)#14,635
2.300412.4%3.6%(-1.18)#3174.4%(-1.97)#15,520
3.300282.3%3.6%(-1.28)#3264.4%(-2.07)#15,891

Common Questions

What are the Top Zip Codes with the Highest Percentage of Population with a Degree in Literature and Languages in Cumming, GA?
Top Zip Codes with the Highest Percentage of Population with a Degree in Literature and Languages in Cumming, GA are:
#1
2.7%
#2
2.4%
#3
2.3%
What zip code has the Highest Percentage of Population with a Degree in Literature and Languages in Cumming, GA?
30040 has the Highest Percentage of Population with a Degree in Literature and Languages in Cumming, GA with 2.7%.
What is the Percentage of Population with a Degree in Literature and Languages in Cumming, GA?
Percentage of Population with a Degree in Literature and Languages in Cumming is 0.95%.
What is the Percentage of Population with a Degree in Literature and Languages in Georgia?
Percentage of Population with a Degree in Literature and Languages in Georgia is 3.6%.
What is the Percentage of Population with a Degree in Literature and Languages in the United States?
Percentage of Population with a Degree in Literature and Languages in the United States is 4.4%.